Why Does the 3km-NAM Persistently Overforecast Tropical Cyclone Intensities?
Hello everyone!
Today’s blog post is more of a look in the rear-view mirror at some model forecasts for Arthur that turned out to be very, very wrong. The model in question is the 3-km NAM, which is one of the high-resolution models used to predict thunderstorms and other features that the lower-resolution global models can’t “see”. Given that tropical cyclones are organized thunderstorm clusters, shouldn’t this increased resolution be a benefit to their ability to accurately forecast tropical cyclones? This post will attempt to explain why the story is a bit more complicated.
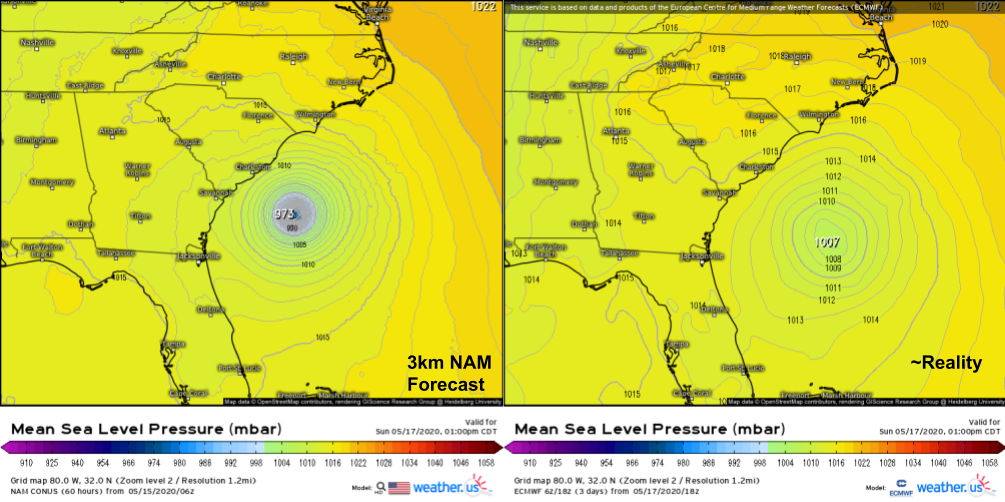
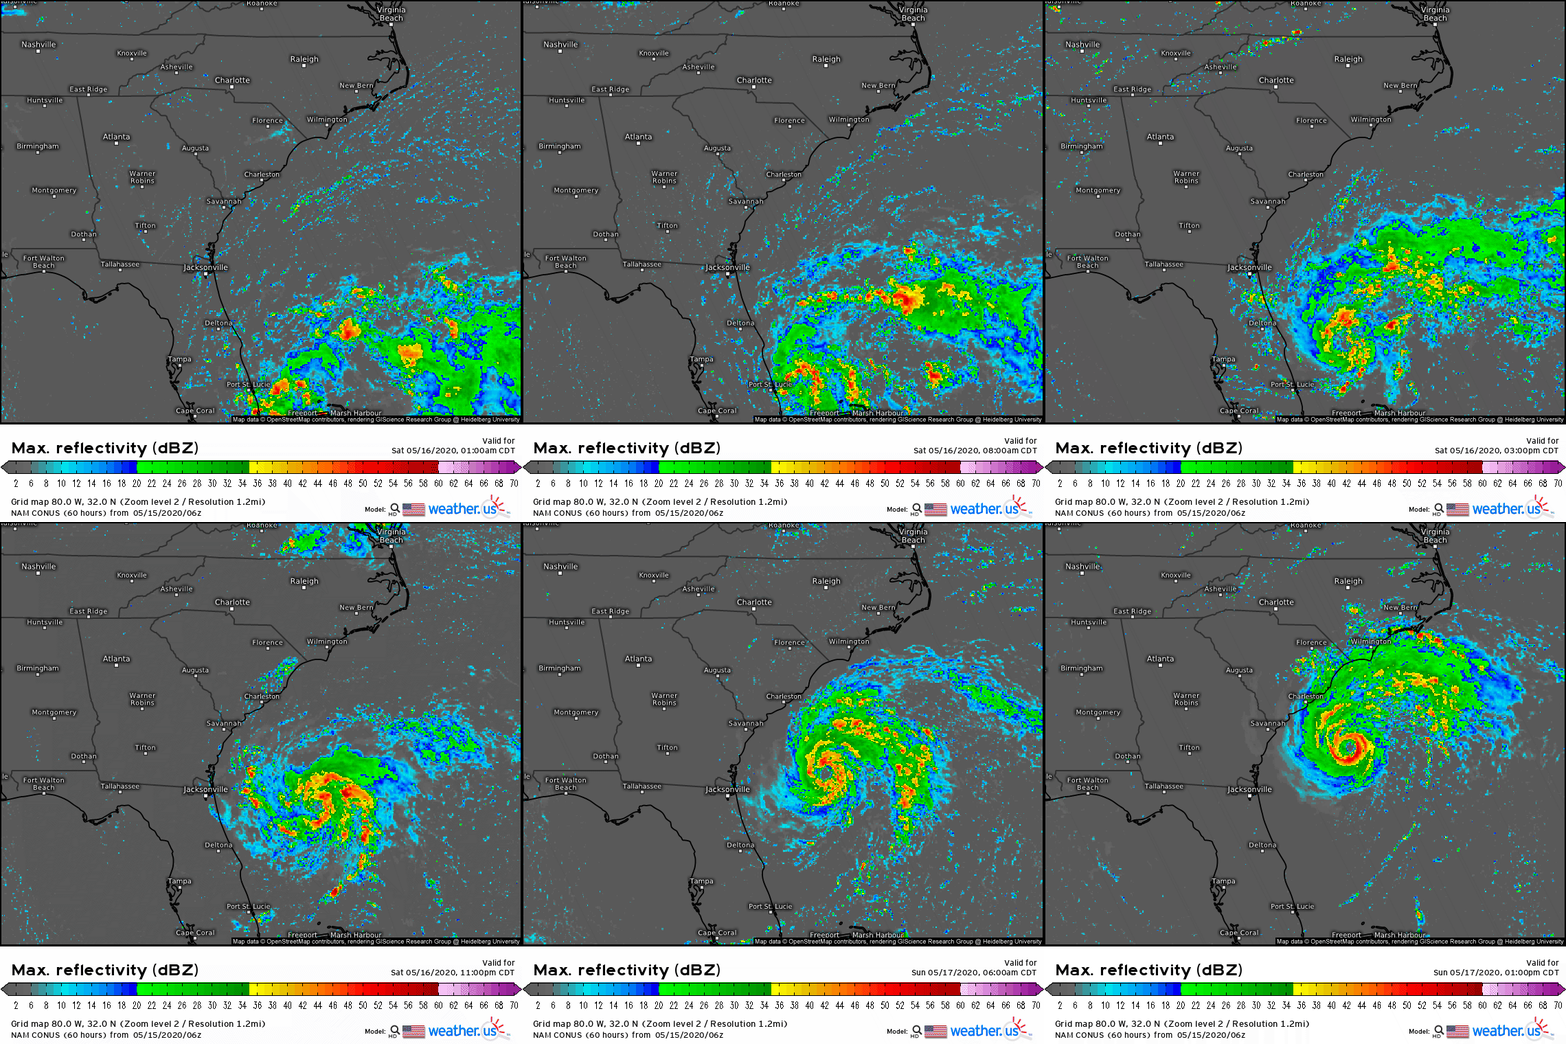
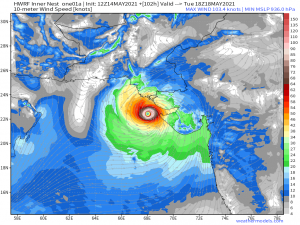
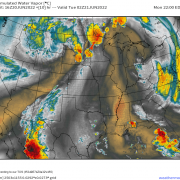
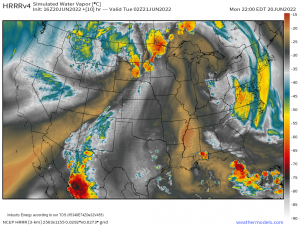
This comparison of the 3km NAM’s 60-hour forecast for Sunday afternoon with the ECMWF’s analysis valid at the same time (not quite reality, but very close for the purposes of this comparison) provides a succinct statement of the problem: the NAM was expecting Arthur to intensify into a hurricane, but it actually remained a weak tropical storm. It should be noted that this is hardly the first time the NAM has produced such erroneous forecasts for tropical cyclones. Last year, it suggested Hurricane Barry would intensify to a category 3 storm before landfall, and it forecasted the central pressure of Hurricane Harvey to drop to a record-breaking 860mb back in 2017. Both storms were substantially weaker (though still impactful) than these forecasts.
So where does the NAM go wrong when trying to predict the intensity of tropical cyclones and why is this error so persistent?
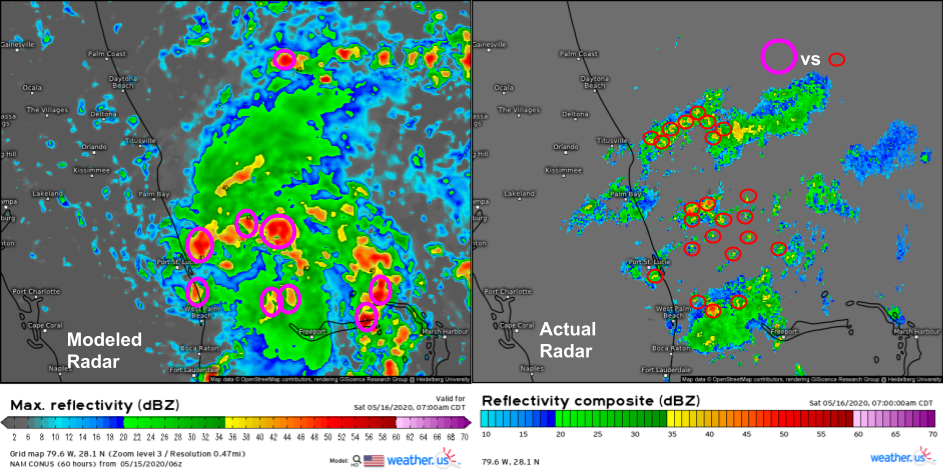
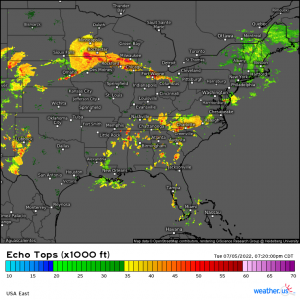
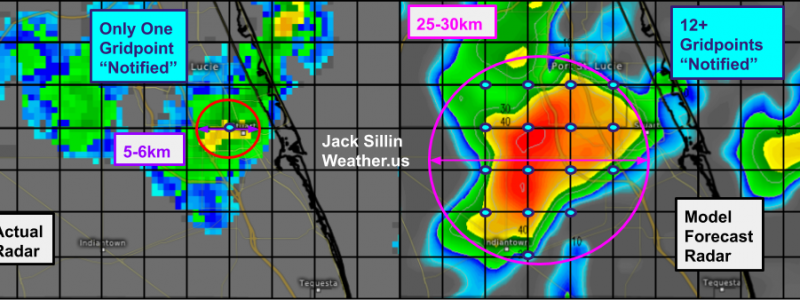
This comparison of the NAM model’s forecast for radar imagery on Saturday morning with observed radar imagery highlights the heart of the problem: the NAM is consistently expecting thunderstorms to be much larger than they actually are. Each pink circle represents the approximate size of a thunderstorm forecast by the NAM while each red circle represents the approximate size of an actual observed thunderstorm. Of course the size of thunderstorms both modeled and observed aren’t exactly the same as they appear on these radar maps, but without modeled and observed vertical velocity fields, this is as close to an apples-to-apples comparison as we’re going to get.
Why is the NAM so persistently overestimating the size of thunderstorms? The answer has to do with the difference between model grid spacing and model resolution.
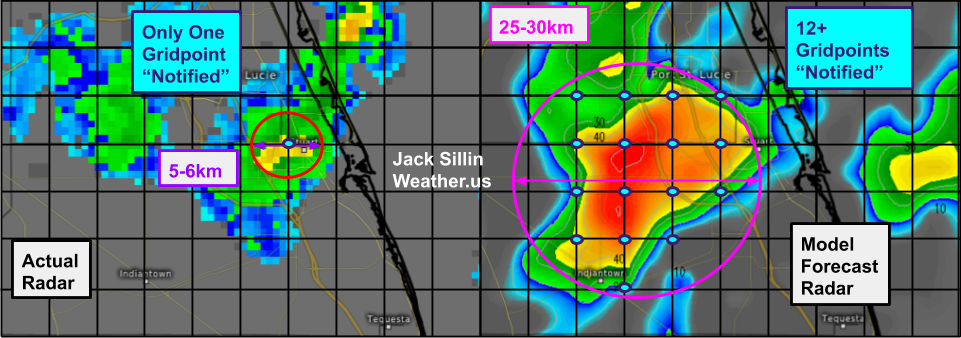
A model’s grid spacing is defined as the horizontal distance between successive grid points. In the case of the 3km-NAM, this grid spacing is 3km (hence the name). This means that the model runs calculations for points 3km apart. But can it “see” the thunderstorm over Stuart Florida that’s ~5-6km across? A perfect forecast might be able to see that something’s up at the one grid point (or maybe two) located at the center of that thunderstorm. But the model won’t be able to resolve the thunderstorm (i.e. paint a complete picture of the storm’s circulation) with only one grid point. To get a better intuitive sense of this, let’s imagine trying to draw a mountain with only one dot.
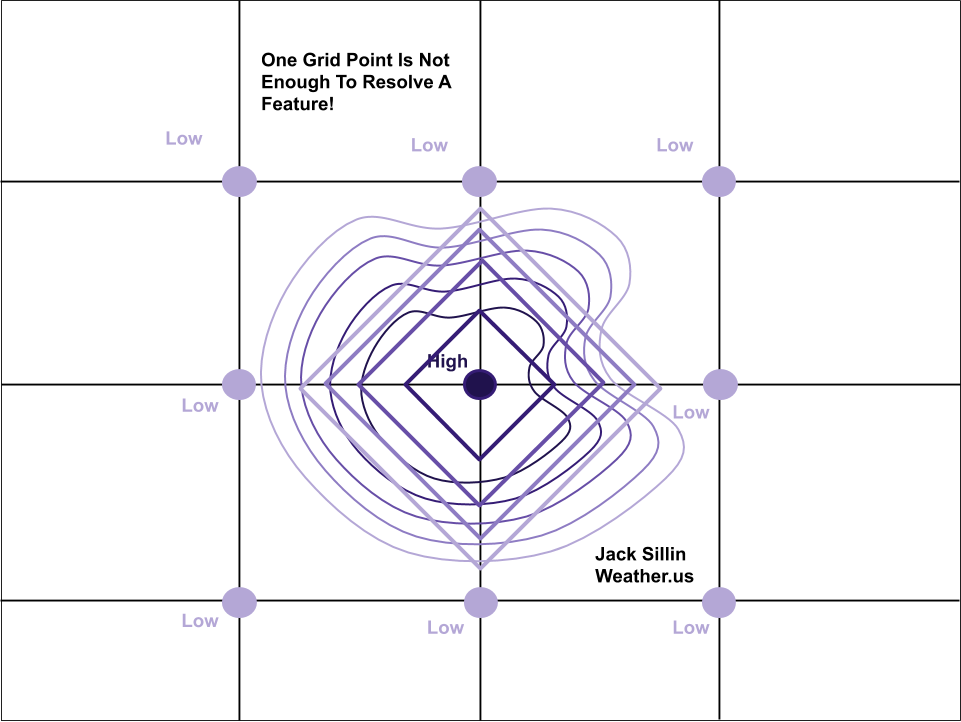
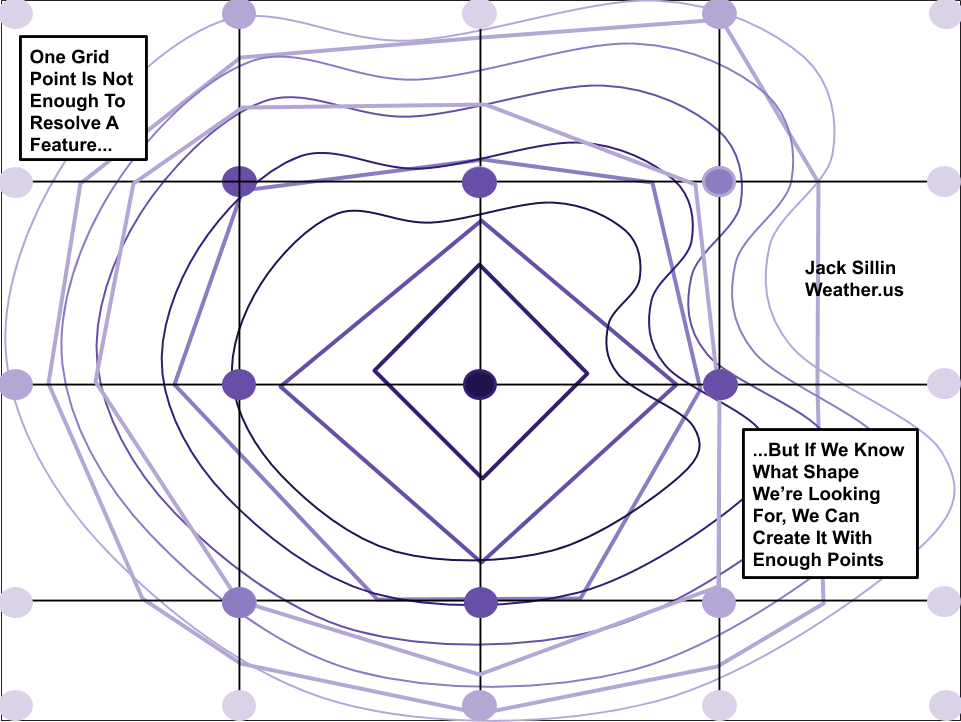
This diagram shows a hypothetical mountains described by some curved contour lines. The mountain is small, and fits within four hypothetical model grid boxes such that only one model grid point “knows about” the existence of the mountain. Thus the model will assign a high elevation value to that one center grid point, and low elevation values to all others. This will produce a model-estimated “mountain” with contour lines that are perfectly square. Without any information on how elevation changes locally where there aren’t any grid points, the model can only guess that no variation occurs.
This concept is exactly what happens to small thunderstorms in weather models. But we know diamond-shaped thunderstorms don’t actually occur in the atmosphere. So to produce a semi-realistic picture of what an actual thunderstorm might look like, models create thunderstorms that are bigger than they would be in reality.
Here’s an (albeit messy) attempt to illustrate that with our hypothetical mountain. Assume the model wants to create a mountain with a shape more closely resembling the actual mountain (a steep slope on the eastern side and a more gradual slope on the western side). It can do this by creating a mountain that’s much larger than the actual mountain so it has more grid points to analyze. Note that the model-produced contours on this plot start to resemble the shape of the actual mountain. However, we haven’t changed the grid spacing. Our simulated mountain now has a more realistic shape, but it’s much larger.
With that in mind, lets revisit the radar comparison from above.
The NAM (right panel) has produced a thunderstorm that looks somewhat similar to the actual thunderstorm observed by radar imagery (left panel). However, while the actual thunderstorm only would “notify” one model grid point of its existence, the simulated thunderstorm has more than a dozen grid points working to describe its shape and intensity. That’s the only way we can get a realistic-looking thunderstorm from a model with discrete grid points.
What does all this have to do with predictions of tropical cyclone intensity? Recall that tropical cyclones strengthen when thunderstorms develop and release latent heat through the process of condensation (and, to a lesser extent, freezing). This latent heat is the fundamental energy source for a tropical cyclone. The larger and more intense a system’s thunderstorms are, the more water vapor they will condense. Therefore, a large thunderstorm will add lots more energy to the system than a small thunderstorm. This energy is “used” by the developing cyclone to lower the central pressure via the expansion of the atmosphere in response to the latent heating discussed above. A lower central pressure means a stronger pressure gradient force to strengthen the system’s winds, which bring in more water vapor from surrounding areas. This additional water vapor represents additional fuel for even larger storms to develop, and the cyclone intensifies.
This is what the NAM model was expecting. It forecast a giant clump of thunderstorms near the center of the developing system which would support the feedback loop I outlined above. There’s nothing wrong with that forecast except that it assumes the thunderstorms at the beginning of the forecast are large enough (and persistent enough) to keep the feedback loop going at a fairly rapid pace. We already saw that the actual thunderstorms were much smaller than the NAM anticipated.
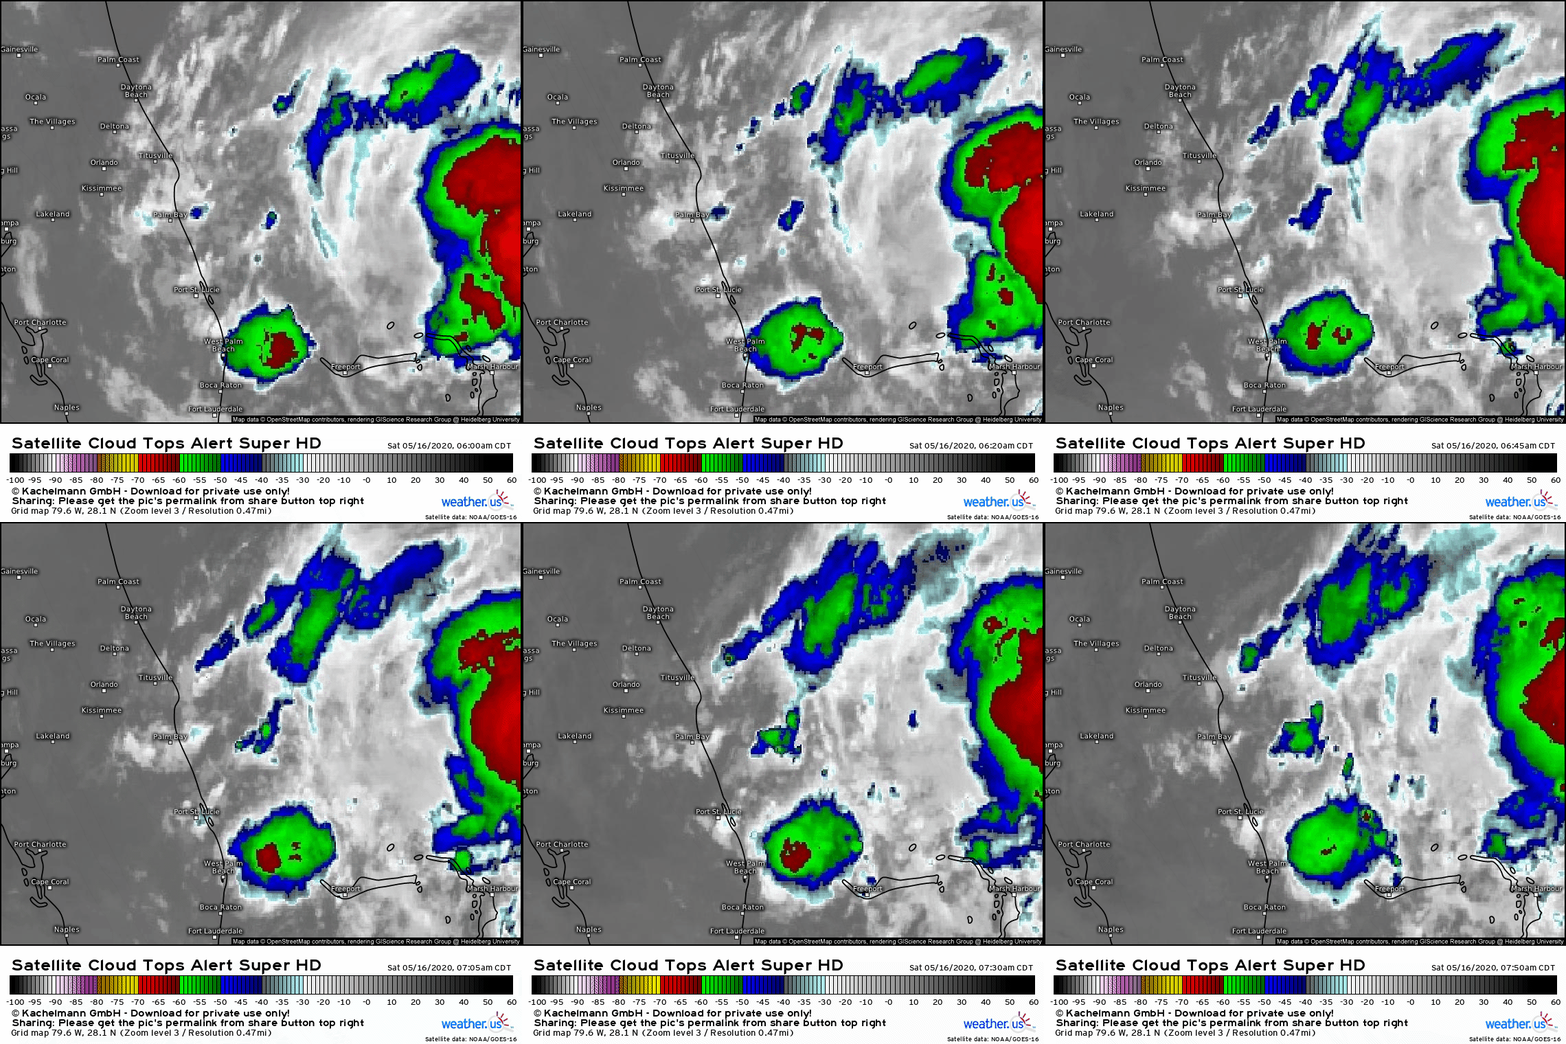
Here’s what the thunderstorms near the storm’s center actually looked like on Saturday morning: disorganized, small, and not particularly intense. Eventually, the feedback loop discussed above did occur, but because the thunderstorms involved were so much smaller than the model forecast, that process unfolded much slower. Instead of intensifying from a disorganized tropical wave into a strong hurricane, the system intensified from a disorganized tropical wave into a semi-organized tropical storm.
One last interesting question to consider is why the NAM struggles with this overactive feedback loop in a way that global models like the ECMWF and GFS don’t. The answer is that the global models don’t even pretend to see individual thunderstorms. When certain conditions for thunderstorm formation are met, they just make an adjustment to temperature/moisture/mass fields that’s similar to what the actual impact to those fields would be if thunderstorms actually occurred. This “educated guess” about the impact of non-specific thunderstorms on the larger atmosphere is known as “convective parameterization” and is a process that has been finely tuned over many years of scientific work on weather models. It’s far from perfect, but it tends to minimize errors associated with the runaway feedback loop described above.
Now that you know a bit more about the inner workings of weather models, especially the 3km-NAM, remember to take it with a grain of salt especially when it’s forecasting extreme intensification of a tropical cyclone.
For more discussion of weather models, check out our “model mania” series. As always, you can access model data (both from the 3km NAM and the global models) on weathermodels.com and weather.us.
-Jack
