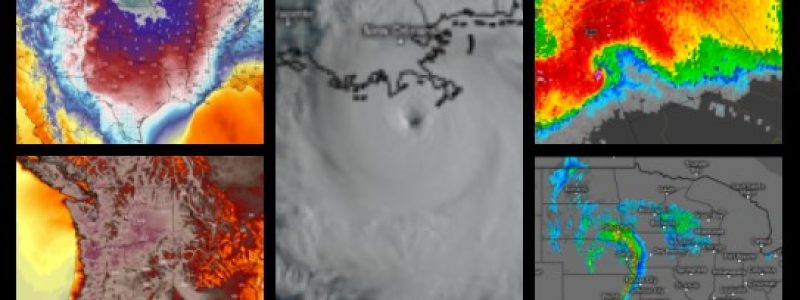
The Most Significant Weather Events of 2021
Well, here we are at the end of 2021. Hard to believe the year has flown by already, isn’t it? As we reflect on the year that has passed, let’s take time in this blog to look back on the impactful weather of 2021 – of which there was plenty!
Since each event impacted different regions in different ways, I don’t believe it’s really fair to “rank” them. Instead, we’ll be taking a look at the 5 events that really stuck out in my mind when I reflected on 2021’s weather. Thanks to some end-of-the-year mischief, that list has been adjusted some. Nevertheless, I believe I’ve covered most of the bases below:
Central US Extreme Cold
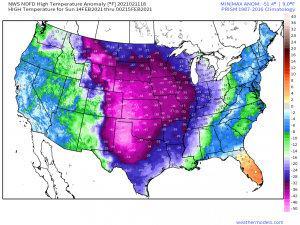
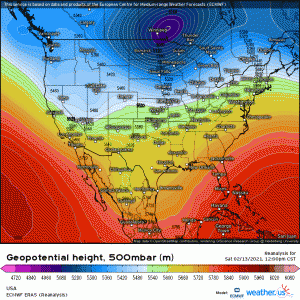
Sometime around the start of the second week of February, models identified the potential for a rather anomalous Arctic air intrusion that would allow frigid air to infiltrate the US essentially from the Canadian border all the way to the Gulf Coast.
It seemed unreasonable or maybe even pure fantasy. Unfortunately, it was neither.
A deep-digging trough spawned a system that not only opened the door for the anomalous air mass, but sent that frigid air south with gusto as the system passed. This lead to significant snowfall on the cold side of the storm. In part of the event fueled by warmer air from the Gulf overrunning the cold air, those further south in more marginal temperatures saw significant icing.
And then the cold air settled in.
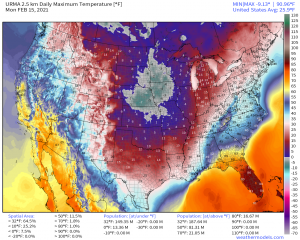
Sub-freezing high temperatures were recorded all the way down to the Texas and Louisiana coasts. Wind chills dipped below zero. On February 15th roughly 149 million people were experiencing highs below freezing. A few locations set all-time record lows such as Fayetteville, AR (- 20 degrees F) and Hastings, NE (- 30 degrees F). Many others broke daily record lows or experienced the coldest temperatures recorded in a long time.
These temperatures complicated recovery from the crippling snow and ice that hit the region just the day before – especially for the southern states. Enduring sub-freezing temperatures meant the snow and ice didn’t simply melt away the next day. Road crews were unable to clear the roads, making travel nearly impossible. To make matters worse, a second system rolled through merely 2 days later, dropping more snow and ice on top of what had already accumulated.
In addition, the extra power needed to heat homes through multiple sub-freezing days and nights caused the Texas power grid to fail and rolling blackouts were put into place. Millions were left without heat.
Just over a week later from the initial onslaught, ridging finally built back in, bringing warmer air back to allow the region to thaw out. It was too late for some, however. Over 200 deaths were recorded in the US – directly or indirectly – due to this event.
Western US Extreme Heat
This event began much like the record-shattering Arctic air intrusion in February – with models putting out some alarming values.
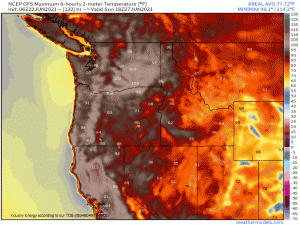
Heat on the order of temperatures well into the triple digits for MULTIPLE days was forecast. Once again, we hoped it was model fantasy or at the very least over exaggeration. Once again, we were wrong.
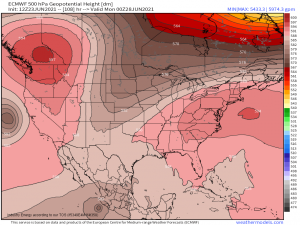
An anomalous ridge was forecast to build in. Geopotential Height values close to the magical number of 600 dm – indicating extremely warm air at the surface – were forecast.
Exacerbating these forecast conditions was the fact that this region was in the grip of an extremely significant drought. Heat is often mitigated by evaporation. Of the incoming solar energy, a certain amount is allotted to evaporation. This is a bit of a watered-down version but: When the soil is wet or even damp, some of the sun’s energy goes to fulfilling part of the water budget through evaporation while the rest is used to warm the surface. When there is no moisture to evaporate, there is nothing for that reserved energy to do other than warm the surface, leading to more heat.
All signs pointed to a significant event. And they were, unfortunately, correct.
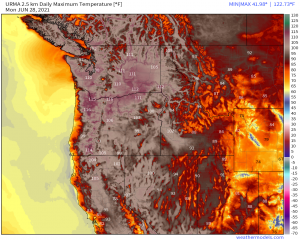
An Omega Block pattern emerged, causing the ridge facilitating highs above 100 for many to stall for an unbelievable four days. Heat began building in slowly on June 25th. A mere day later, widespread highs in the triple digits were being observed, smashing records.
These new records were smashed once again when the heatwave peaked on June 28th. In fact, many cities set heat records on the 26th, broke them on the 27th, and broke them once again on the 28th.
A stunning example would be Portland, OR whose previous record was 107 degrees set in 1965/1981. The city reached 108 degrees on the 26th, 112 degrees on the 27th, and finally peaked at 116 degrees on the 28th, setting an all-time high.
Seattle experience something similar, though perhaps more astonishing. Previous to this event, in the past 126 years Seattle had only cracked 100 degrees three times. On June 26th, they reached 102 degrees followed swiftly by 104 degrees on the 27th, and a whopping 108 degrees – setting the all-time high – on the 28th.
Outside the US, Lytton, British Columbia set an all-time record for the entirety of Canada of 121 degrees on the 28th. Unbelievable!
Heat is often the “silent killer” of meteorology. When people think of meteorological disasters, they picture a hurricane or perhaps a tornado outbreak. Extreme heat that hits a region ill-prepared and unused to it, like this event here, is a recipe for absolute disaster.
Many in these regions did not have access to proper ways to keep their bodies from overheating. To make matters worse, not only was it hot during the day, but temperatures refused to cool significantly overnight, denying the population a chance to “reset” to face the next day’s heat. Unfortunately, this lead to many deaths. Over 1000 deaths have been attributed to the heatwave. Though the majority of those occurred in Canada, both Washington and Oregon also recorded their fair share.
This event was a perfect storm of circumstances (drought, climate change, a blocking pattern) combining to produce an astonishing event that, we hope, will not be repeated any time soon.
Hurricane Ida
We technically had a very active 2021 Hurricane Season. However, more than a few storms remained weak or out to sea. It’s not much of a leap then to call Hurricane Ida this season’s “big deal.” Though I began writing for the weather.us/weathermodels blog at the tail end of the 2020 Hurricane Season, Ida was the first serious US Threat I tracked from inception to landfall and beyond. I therefore remember it quite vividly – and probably will for quite a long time.
99L, Ida’s initial identity, came swiftly on the heels of Fred and Henri. Both were weak storms, categorically speaking, but caused prolific flooding. Fred inundated Western North Carolina. Henri soaked parts of the Northeast. A water-weary Eastern US then turned to this newcomer, 99L, lurking in the Caribbean.
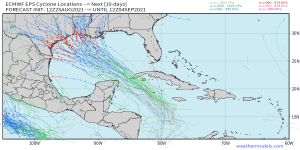
99L’s future was rather uncertain at first. Early spaghetti models suggested a wide range of geographical destinations for the storm. Landfall anywhere from the southern tip of Texas all the way over to the Mississippi Coast seemed to be a possibility.
A few factors added to the uncertainty:
- Where would the center form? The track would have to adjust accordingly once that occurred.
- How strong would the storm be early on? A stronger storm would be steered by winds in the upper levels. A weaker storm would feel the direction of the lower level winds. The storm’s strength would make the difference between a Texas landfall vs a Central Gulf Coast (LA/MS) landfall.
- What sort of land interaction would there be? Would it thread the needle between Cuba and the Yucatan Peninsula? Cross the relatively flat western end of Cuba? Or would it cross Cuba’s higher terrain and get shredded along the way?
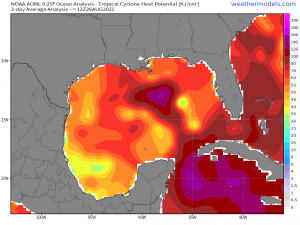
Only one thing was certain. If 99L survived its trip out of the Caribbean, it would find near-perfect conditions for rapid intensification. Bathtub warm waters and very little shear awaited the storm in the Gulf.
And survive it did. The quick-moving storm would become Tropical Storm Ida and then Hurricane Ida shortly before landfall in western Cuba on August 27th at 7:25 PM EDT.
Less than 4 hours later, at 11 PM EDT, Ida emerged into the Gulf, virtually unscathed by its very brief interaction with land. It was now free to begin a period of rapid intensification in the shockingly warm waters of the Gulf, uninhibited by either land or shear.
Less than 24 hours later, Ida was a strong Category 2 hurricane with maximum sustained wind speeds of 105 mph and a central pressure of 964 mb.
At this point, a landfall along the Eastern Louisiana coast was a lock. Rapid intensification was expected to continue right up until landfall, with at least a strong Category 3 hurricane expected to slam into the Central Gulf Coast.
Ida blew right past Category 3 and peaked as a Category 4 hurricane with sustained winds of 150 mph – merely 7 mph short of official Category 5 status – and a central pressure of 930 mb. At this intensity, Ida tied both the Last Island Hurricane (1856) and Hurricane Laura (2020) for strongest hurricane, based on wind speed, to strike Louisiana.
In its final hours before landfall, Ida began an eye wall replacement cycle, halting its impressive period of rapid intensification. Although, while the hurricane was no longer gaining strength, it did not weaken either. Further, an eye wall replacement cycle allows the wind field to expand, extending the distance from the center at which hurricane force winds can be felt.
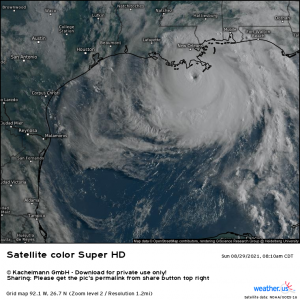
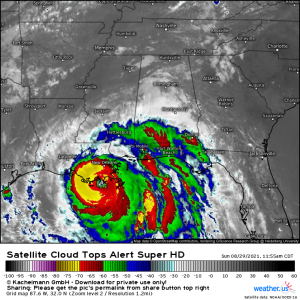
A very dangerous Category 4 Hurricane Ida made landfall near Port Fourchon, Louisiana at 12:55 PM EDT on August 29th.
Thanks to the warm waters of the swampland that makes up southern Louisiana, Ida did not weaken as it moved slowly inland. Instead, it remained a major hurricane until its eye passed just west of New Orleans, roughly 9 hours after landfall.
While winds can obviously do a lot of damage during a hurricane, the biggest threat is the water component. This comes in the form of storm surge and freshwater flooding.
Maximum storm surge of 8 to 10 feet occurred in the right front quadrant of the hurricane, inundating coastal towns. Between the winds and the surge, the island community of Grand Isle, LA was rendered uninhabitable.
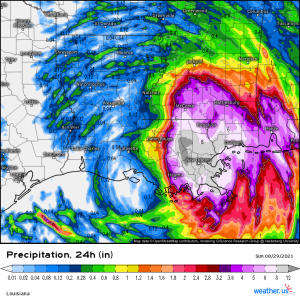
Ida’s rainfall was also intense. The slow-moving, slow-weakening storm continuously fed off moisture from the Gulf and the swamplands. Radar estimated rainfall suggests that over 12 inches of rain had fallen just west of New Orleans in under 24 hours.
Between the surge and the rainfall, many wondered if the levees, put in place after Katrina, would hold. And hold they did! However, a levee in Jefferson Parish was overtopped, flooding the lower part of the Parish.
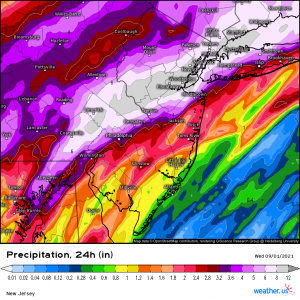
As with most, if not all, landfalling tropical cyclones, Ida’s effects did not simply stop at the coast. What remained of Ida would go on to interact with an incoming frontal boundary, maximizing rainfall over an already-saturated region.
The result: flash flood emergencies were issued for parts of New Jersey, New York, and Connecticut. It was during this event that the first ever Flash Flood Emergency was issued for New York City as the city drainage systems failed to keep up and waters rose to dangerous levels.
Ida’s remnants also spawned a particularly intense regional tornado outbreak in the Mid-Atlantic states. One EF-3 tornado was recorded while a long-track EF-1 prompted a tornado emergency from Bristol, PA to Burlington, NJ.
When all was said and done, Ida tied or set records from the Gulf Coast all the way to New England, assuring it a place in history.
December 10th – 11th Tornado Outbreak
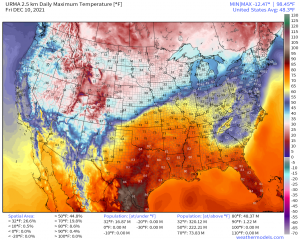
While most of the Eastern US had been experiencing a rather mild, or at times a shockingly warm, December, the month did not come without cold air intrusions. As any meteorologist or meteorology nerd knows, the clash of anomalously warm air and incoming cold air rarely ever sees a quiet conclusion.
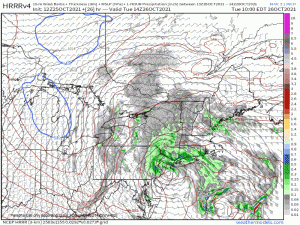
Notice extremely warm temperatures bordering on 60 degrees all the way up in Indiana and Illinois as well as below freezing air not far behind. That should set off some warning bells.
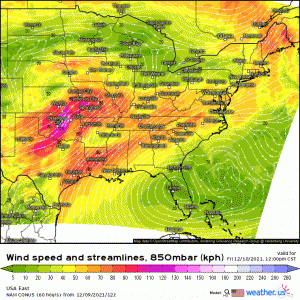
A surface low would form as a trough descended the Rockies. This low would then deepen as it moved northeast, creating a ripping low level jet.
As this jet cranked up, it sent warmth and moisture flying northward, destabilizing the air all the way to the southern reaches of the Great Lakes. Due to cloud cover, instability was somewhat limited, though it did spike more than initially forecast when some breaks in the clouds materialized and held, especially over NE AR, W TN, and W KY.
Whatever was lacking in instability was made up for by deep layer shear on the order of 50+ kts. With shear like that, it doesn’t take too great of a push to set things spinning. And the front would indeed provide an ample push.
One major downside to this threat was the timing. Convection wasn’t expected to initiate until after dark, making this event a very dangerous nighttime tornado threat.
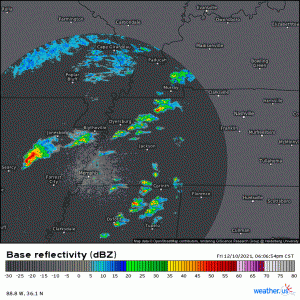
Late in the 5 o’clock hour, central time, it began. It quickly became apparent that one single supercell, alone and unhindered by any near-by convection, would the dominant threat.
Many of us watched in horror as unbroken tornado warnings were issued one after the other after the other for this supercell as it traversed first Arkansas, cut across far SE Missouri, crossed the Mississippi River, entered Tennessee, and then finally entered Kentucky.
This single storm, originally dubbed the “Quad-State Tornado” and later adjusted to the “Quad-State Supercell,” plowed mercilessly through the four states mentioned. Though the supercell itself traveled over 350 mi over a total of 8 hours (via NWS), it was determined to be 2 separate long-track tornadoes with a combined path of 246 miles. The first was on the ground a total of 80.3 miles – from NE AR to just below the TN/KY state line in far NW TN. It lifted briefly before putting down another, extremely violent long-track tornado. This particular tornado was determined to be on the ground for a whopping 165.7 miles before finally dissipating in far North Central KY.
While the fact that this was indeed two tornadoes means that the record for tornado with the longest track still belongs to the Tri-State Tornado of 1925 (219 mi length), that hardly matters in the face of the extreme damage these two wrought.
At their strongest, these two tornadoes were rated EF-4 with winds of 190 mph. Towns along the way such as Monette, AR, Mayfield, KY, Dawson Springs, KY, and Bremen, KY sustained unimaginable damage. Entire portions of these towns were wiped off the map with buildings swept completely clean of concrete foundations.
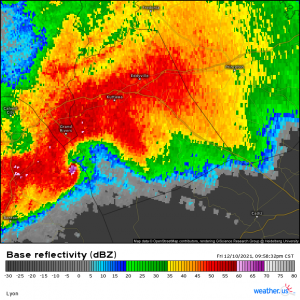
There is one single image from this outbreak that will linger in our minds for a long time, however.
This radar image is from the moments just before the second tornado ripped through Mayfield, KY. It is the textbook image of an extremely powerful tornado complete with something rarely seen before: a three-body scatter spike produced by the radar beam refracting off of the debris which had been lofted over 30,000 ft in the air. Chilling doesn’t even begin to describe it.
This, of course, wasn’t the only tornado that occurred during this outbreak. Sixty-six total tornadoes were confirmed by the NWS. Of these, 23 were considered “strong” (EF-2 or higher) and did considerable damage to towns like Bowling Green, KY. As of December 28th, the death toll stands at roughly 85 people, with 77 of those deaths having occurred due to the Kentucky EF-4.
As bad as this outbreak was, it unfortunately wasn’t the final chapter in a violent December.
December 15-16 Severe Outbreak
While the Mid-South was still picking up the pieces from violent tornadoes, another threat materialized – forecast for a mere 4 days later. Uncertainty abounded at first, but it quickly became clear that yet another potent threat lurked for the unusually warm Eastern US.
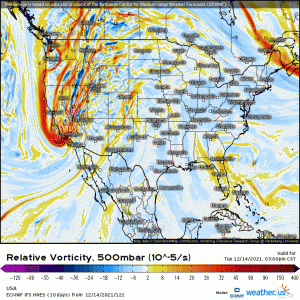
An energetic shortwave trough would lift north out of California and into the Rockies. On it’s descent, it would undergo surface cyclogenesis and form a rather deep low. This system enabled the possibility of a variety of potentially nasty weather: high winds, extreme fire weather, and yes, a severe threat.
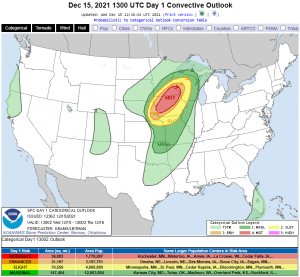
Many were shocked, myself included, upon waking up to see a Moderate Risk outlined in the Day 1 Outlook for December 15. Details that had been uncertain merely 2 days prior suddenly became clear, and they were astonishing.
Once again, anomalous warmth and moisture would be advected northward via a strong low level jet ahead of a deepening surface low. Instability was marginal, so the greatest risk would be closer to the center of the low where the forcing was stronger. This put the bullseye in states that, until December 15th, had never experienced a moderate risk in the month of December. But before convective initiation even occurred, this system was all about causing issues.
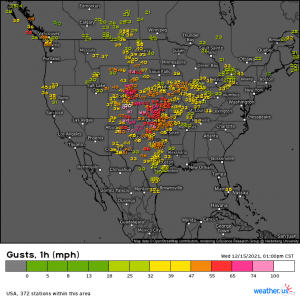
The forming surface low deepened rather quickly. At the same time, a strong area of high pressure was hanging out just off of New England. The pressure gradient between these two produced some incredible winds not related to any thunderstorms.
A station in Lamar, CO recorded a gust of 107 mph. Wind speeds in excess of hurricane force were widespread elsewhere.
These non-thunderstorm winds blew hard over areas that were already very dry. The extreme gusts combined with the lack of moisture in the air lead to the issuance of a not-often-seen Extreme Fire Weather Risk for parts of TX, OK, and KS. A few fires spread quickly, driven by these gusts.
Around 1 pm CST, some showers and storms coming out of western Kansas and far southern Nebraska began to organize themselves into a line. As they moved northeast into an area already primed with warmth and moisture, they exploded into a potent bowing line of storms – a derecho.
When all was said and done, this event was a bit of a record breaker. It managed to accomplish quite a bit during its roughly 700 mi, 10 hour journey.
Though the damage was thankfully not on par with the 2020 Iowa derecho, this event broke the record for most significant (75+ mph) wind gusts in a single day – 61 reports at the time this blog was written. It is also the only December derecho recorded in the United States.
At the time this blog is being written, 91 tornadoes have been confirmed from this event. A few of these made history as the first ever recorded December tornadoes for the state of Minnesota.
Between this event and the December 10/11 outbreak, a whopping 157 tornadoes have been confirmed in less that a week’s time. IN DECEMBER. And yes, that is also a record. The previous record was a total of 99 set back in 2002.
This, of course, isn’t a comprehensive list of 2021’s extreme weather. We also experienced a horrific fire season in the West, a few strong Atmospheric Rivers, and some extreme flash flooding that broke local and/or state records. However, I feel I touched on some of the bigger events in what was indeed a unbelievable year of weather. Hope you enjoyed reading it as much as I enjoyed writing it!
**all stats courtesy of NWS analyses.
