The Anatomy Of A Destructive Tornado North Of Fargo, ND
Hello everyone!
Instead of going over a forecast or talking about a pattern, today’s blog will focus on looking in the rear view mirror to learn more about how the atmosphere works. Through an incredible stroke of luck, a powerful tornado developed within miles of a radar tower just north of Fargo, ND. The data obtained from this event gives us a powerful tool to examine how tornadoes form. I’ll break down each part of the cell’s life from the moment the storm formed through its tornadic phase and until it merged with other cells over Southern Minnesota, nearly 6 hours after it first developed.
There is enough meteorology in this radar progression to fill numerous theses. I’ll try to focus on the most basic and most noteworthy features, explaining them as I go. If there’s something you still don’t understand, leave a comment or drop me an email at jack@weather.us so I can explain it in a future blog post.

At 4:37 PM, CDT, a small shower popped up 105 miles NW of Fargo, ND and quickly grew into a small storm.
The storm that would later go on to produce the tornado just north of Fargo began as a small storm 105 miles NW of the city. It initiated in an environment that was very favorable for thunderstorm development. At 5 PM, CDT, dew points were in the upper 60’s to low 70’s across far eastern North Dakota with dew points in the 50’s just west of the area. The thick blue curved line visible on the radar images above is likely the boundary between these two airmasses.
The boundary between two airmasses of equal temperature but different dew points is known as the dryline. Drylines are notoriously good triggers for severe thunderstorm development.
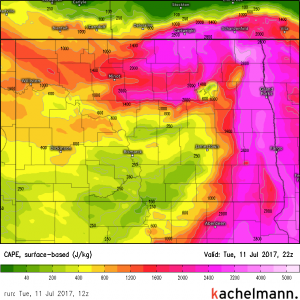
East of the dryline, plenty of CAPE was present with hot temps and high humidity. There was plenty of fuel for any storms to harness. The trigger mechanism was the dryline, a boundary between airmasses of different densities, similar to a front. As our little shower moved across the dryline and into this environment, it took off and rapidly strengthened into a strong storm. Upper level winds were also strong enough to support strong storms. Conditions were all set for severe thunderstorms, and that little shower NW of Fargo was ready to take advantage.

The initial shower quickly grows into a strong storm and other cells begin to merge with it as rotation begins.
The shower then moves across the dryline into the favorable environment, at which point it rapidly intensifies. In the favorable environment, other, smaller cells develop too and get sucked into the main storm’s circulation. Notice how the dryline boundary develops a small kink by 5:08 PM. This indicates that the storm is rotating with winds moving roughly in the directions of the arrows I’ve drawn on the map. By 5:25, the main storm begins interacting with two stronger cells to the NE.

After merging and interacting with several cells, the storm isolates itself and continues to strengthen.
The period of time from 5:25 through 5:42 featured a period of disorganization for our storm. It was fighting for influence (and warm, moist air) with cells to its north and northeast. Rain cooled outflow from the storms to the north threatened the supply of unstable air that out storm was feeding on. Thankfully for the storm, and sadly for those in its path, by 5:54, the storm had successfully split from the cells to the north and was resuming its strengthening.
By 6:00 PM, CDT, what was once an innocent shower had become a supercell thunderstorm with a powerful, rotating updraft. A hallmark of strong and strengthening storms, the curved beak shaped pattern (black lines), was visible. This signature is caused by air parcels rapidly and explosively rising in the updraft of the storm, located at or just SW (upstream) of the apex of the V.
Because all things with mass and velocity (including air parcels) have momentum, these air parcels continue to rise past the equilibrium level at which they are no longer positively buoyant (warmer/less dense than their surroundings). As their upward momentum runs out, they begin to sink. The parcels don’t sink back into the updraft, but rather fall downstream of the updraft. This sinking motion results in lighter precipitation which is seen as the lighter colors in the center of the storm.
As our storm continues to intensify, the cell to the north develops a hook echo at 6:11 PM. No tornadoes were reported with that cell but it is an indicator that the environment is supportive of tornadoes. Notice how our cell plateaus during this time. It’s waiting for something to push it over the edge.
Our storm continues to plug along towards the southeast as we approach 7:00. It produced a brief tornado shortly after 6:30 and its improved hook echo signature supports this at 6:36. Notice though by 6:42, it’s back to the same form as before 7:30. The storm is still V shaped, indicating its strength. By the time 7:01 rolls around though, the storm suddenly develops a strong hook and drops a much stronger tornado. So what caused the change? Thankfully, it occurred within a few miles of the radar site so we can see exactly what was going on.
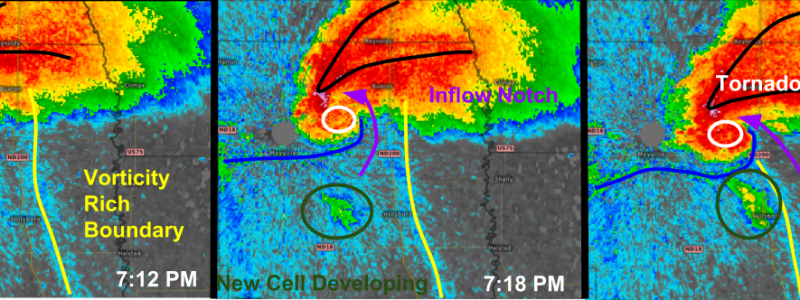
The radar tower is visible in these images as the small grey circle just a few miles south of the storm. It’s the storm’s proximity to the radar that gives us a unique opportunity to observe the formation of what would end up becoming an EF-2 tornado. The feature that ended up pushing the storm over the edge is circled in yellow. A small but important boundary. So what caused this boundary and how did it cause the formation of a tornado?
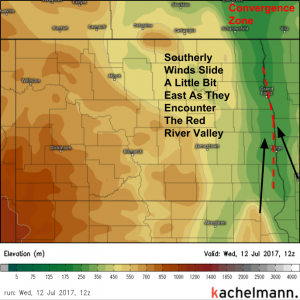
Winds across Eastern North Dakota on Tuesday afternoon were out of the south/southeast. As those winds encountered the terrain of the Red River Valley, the winds veered slightly as the high terrain to the west discouraged the continued NNW movement of air parcels. This subtle and very localized convergence was enough to produce a small band of horizontally rotating air, spinning and stirring around in the valley. Winds blowing in different directions throughout the low levels of the atmosphere also helped to intensify the spin of this air. You can see exactly what I’m talking about on radar. That thin blue line on the radar is bugs, dust, and humidity getting caught up in the atmospheric eddy.
Spin in the atmosphere is referred to as vorticity. Given the proximity of the vorticity to the radar, we know that the vorticity was in the low levels. Given that tornadoes occur in the lowest half mile or so of the atmosphere, it’s important that we have vorticity in the low levels and not just higher up in the storm to get a tornado to form. Notice how, in the images above, the boundary tilts towards the storm as time goes on. This is a sign that the storm is sucking that boundary into its circulation in the low levels of the atmosphere. The injection of intense vorticity in the low levels due to the ingestion of that boundary is likely what prompted tornadogenesis.

Within minutes of ingesting vorticity from the terrain induced convergence zone, the storm reaches peak intensity.
Just minutes after the boundary first interacted with the storm, a clearly defined hook echo appeared along with well defined elements of a healthy, tornadic supercell. A clear notch of low reflectivity was present just east of the tornado that wrapped into the center of the storm. This “inflow notch” continues to feed warm, moist, unstable air into the core of the storm, even as rain cooled downdrafts begin to crank. The Rear Flank Downdraft (RFD) becomes well defined as it passes over the radar site. Winds in excess of 100mph were observed in this downdraft which caused extensive damage, completely separate from the tornado. The “curved V” formation continued to be present, indicating a strong updraft and attendant downstream downdraft.

A new cell develops south of the tornado and wraps into the circulation, intensifying the tornado’s spin.
As the storm tracks south and east, a new cell develops south of the tornado and wraps into the circulation. As additional energy is added to the rapidly spinning vortex, the tornado intensifies as the storm spins even faster. Note that I’ve kept the same colors to mark the same features so refer to the previous image for which colors highlight which features.
Meanwhile, as the RFD continues to plow south, extremely unstable air is forced to rise up and over the developing low level cold pool. This results in new cells forming behind the tornado, a sign that a process known as upscale growth is beginning. It is the upscale growth that eventually throws the storm’s circulation out of whack and causes the tornado to dissipate. While this process is beginning by 7:42, the storm is still strong and the tornado is still on the ground.
As time progresses, upscale growth on the back side of the tornado continues and disrupts the storm’s circulation. Notice how the well defined hook echo (white circle) that is present at 7:54 becomes reduced to just another blip on the radar by 8:11. As quickly as it formed, the tornado was gone. Another new cell formed just south of the storm as the decaying RFD continued its journey southward.
As the storm moved across the border into Minnesota, upscale growth continued as warm air rose up and over the strengthening cold pool produced by the downdraft. In this series of images, you can see the storm evolve from the strong curved shape we observed during its tornadic phase into a much more linear structure. This is a classic sign of the storm becoming downdraft dominant. The warm updraft was no longer controlling the storm, the cold downdraft had taken over. Meanwhile, the outflow boundary from the storm was stretched all the way back to near where the storm started: over 100 miles NW of Fargo.
Despite the fact that the storm was no longer producing a tornado, it continued to produce damaging wind gusts and large hail as it plowed south and east across Minnesota.
The storm briefly attempted to reorganize between 9:16 and 9:37 as shown by the return to the curved/hook signature on radar. however, as the storm moved into the higher terrain west of the Red River, there was no boundary available to inject vorticity into the low levels. As such, no tornado was able to form though destructive winds continued along the leading edge of the rain and hail cooled air. Notice the new cells continuing to form just west of the main storm. This is all part of the upscale growth process that slowly but surely would mean the demise of our storm. At 9:37, the storm entered its 5th hour of life.
Notice how, as more storms form over the cold pool and to the south of our main cell, it rapidly begins to weaken. The deep reds and pinks visible before have given way to yellows and oranges as the storm marches SE. Meanwhile, another storm is moving east through west-central Minnesota. When these two storms merge, the life of our supercell is officially over.

At 10:32 PM, CDT, our supercell merges with another storm over Central MN, ceasing to exist as its own entity.
Exactly 5 hours and 55 minutes after the first signs of our storm appeared on radar, it merged with a storm moving across Central Minnesota, thus ceasing to exist as its own entity. Over the course of its 205 mile journey, it produced two tornadoes as well as straight line winds in excess of 100 mph and hail over an inch in diameter. It’s a classic example of a long lived tornadic supercell and it passed within mere miles of the Mayville, ND radar tower, allowing us to get a very rare peek inside one of these powerful storms.
I hope you learned as much from this storm as I did and hopefully we’ll get to observe another one of these beautiful storms soon!
-Jack Sillin






Thank you so much for the site and the analysis. I enjoy looking at specific events and the storms that lived during said event. This is my new favorite place to spend my free time looking at weather. Please, I beg for more event and storm analysis in the future. Thanks to all involved in this wonderful site.