Intensifying Nor’easter Putting On A Dynamical Show Off The Carolina Coast This Afternoon
Hello everyone!
Instead of my usual forward-looking forecast based posts, I want to take a more current (or, by the time you’re reading this, slightly retrospective) look at the ongoing intensification of the storm off the East Coast. The current system is providing a great opportunity to observe some super cool dynamics in action, and this post will highlight a few of them. It will also offer a bit of an explanation so that hopefully you have a better idea of what’s going on. Of course I won’t be able to cover everything, there is just too much happening, so I’ll focus on the elements that make this system a bit different than most of the nor’easters we usually see develop in this area. The biggest difference is the presence of very intense thunderstorms near the storm’s center. Those thunderstorms are helping to enhance several other dynamical processes near the storm’s core, which are located conveniently within the domain of high resolution satellite imagery from GOES-East and HD radar imagery from Morehead City, offering us a unique opportunity to observe dynamics that typically happen far out at sea.
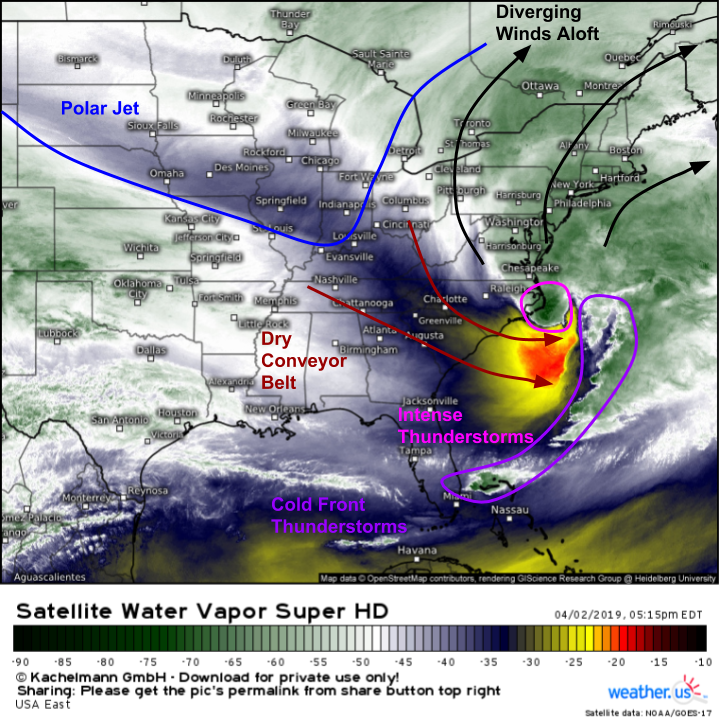
The overall setup is a fairly familiar one. The jet stream is, as always, an important part of the large scale dynamics, with strong divergence noted over and north of the low’s center. Dry air is rapidly descending behind the system to balance out the strong upward motion ahead of it. Strong thunderstorms have formed along the storm’s cold front, which is also fairly typical. The storm was born from an upper level disturbance interacting with a frontal boundary, which I discussed in yesterday’s post. The unusual part of this storm is what’s going on right near the center. Instead of a diffuse area of steady precipitation and breezy winds, this system has intense thunderstorms comprising its core, which is resulting in a compact area of very intense conditions. Additionally, the system is showing off a classic “sting jet” which is rare to see so far south and so close to land (sting jets usually occur in powerful cyclones over the far North Atlantic and North Pacific).
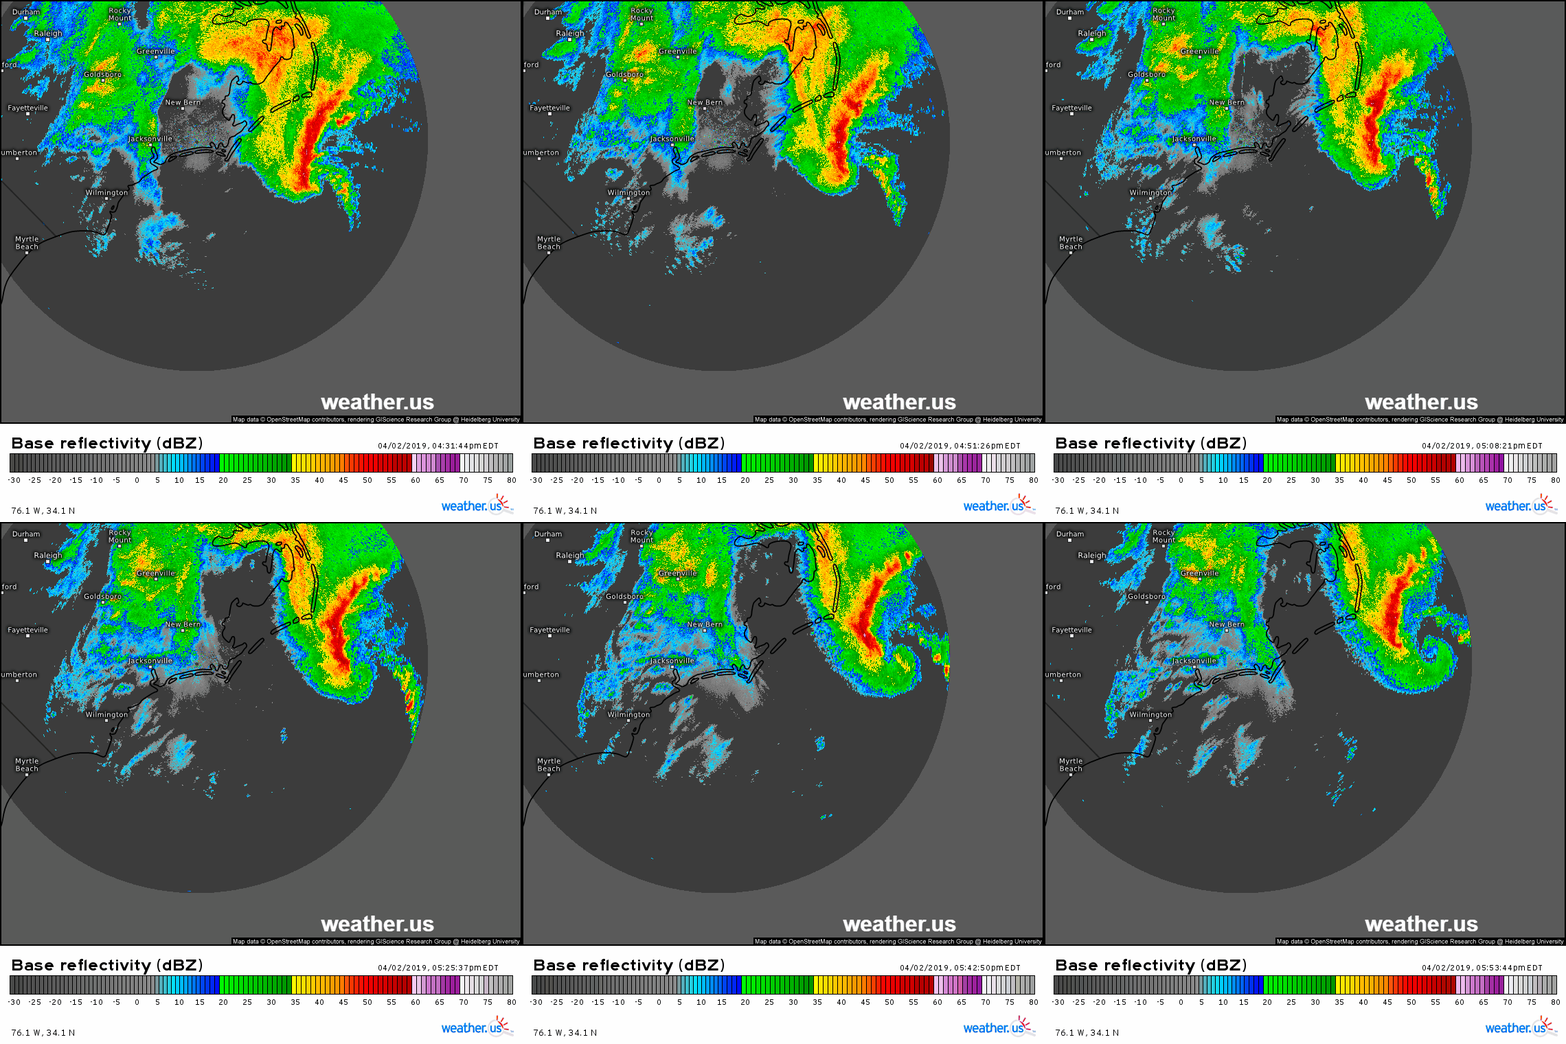
Here’s a look at radar imagery between 4:30 and 5:50 PM EDT this afternoon. The most interesting and impressive dynamics are located near the center of the low, which is the swirl moving ENE just off the Outer Banks. If you’re having a hard time spotting it near the beginning of the loop, it even develops a signature that looks somewhat like a hurricane’s eye by the end (though it’s definitely not a hurricane!).
The first thing to notice is how storm cells in the strong band NW of the center are moving. They generally move NE when the center is far away, then slow down as the center gets closer, then get drawn south as the center makes its final approach. Once the cells in that band are south of the center, they abruptly dissipate. What’s going on with that? The answer lies in a structure known as the “sting jet” and its roots higher up in the atmosphere. The sting jet is a fascinating phenomenon, and my explanation here will be by no means complete, but hopefully will offer at least a little more clarity.
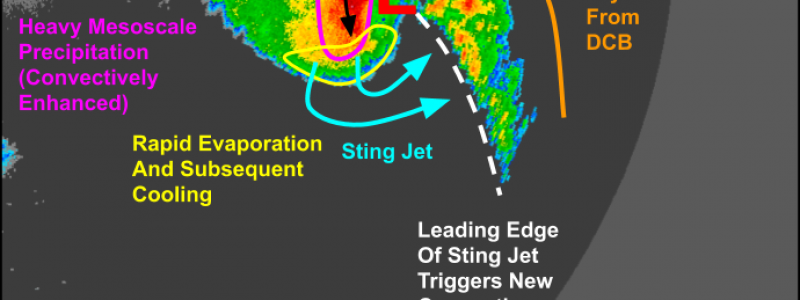
Here’s a look at water vapor satellite imagery, along with a rudimentary conceptual schematic of how various windstreams interact to produce the sting jet. Each “conveyor belt” is just a current of air that has similar characteristics (warm, cold, or dry). Each conveyor belt is involved in producing the sting jet in different ways. First, you need the cold and warm conveyor belts to interact just NW of the low’s center to produce heavy mesoscale precipitation. That’s the band of red you see on the radar loop above. In this case, that band is supercharged by convection (thunderstorms) that are providing an extra boost to upward motion, resulting in even more precipitation. Once this band exists, then the dry conveyor belt can enter stage right. The DCB descends from near the top of the troposphere well NW of the low down into the low/mid levels just S of the low. It then wraps around the east side of the low, bumping into that heavy band of precipitation. As the dry air hits the precipitation, some of the raindrops and snowflakes start evaporating. That evaporation cools the air due via latent heat exchange, which in turn makes that particular air parcel heavier relative to its surroundings. Once this happens, it begins sinking towards the ground, accelerating as it does so. That accelerating current of descending air is the sting jet, and where it intersects the surface, wind gusts can rapidly spike above 70 mph.
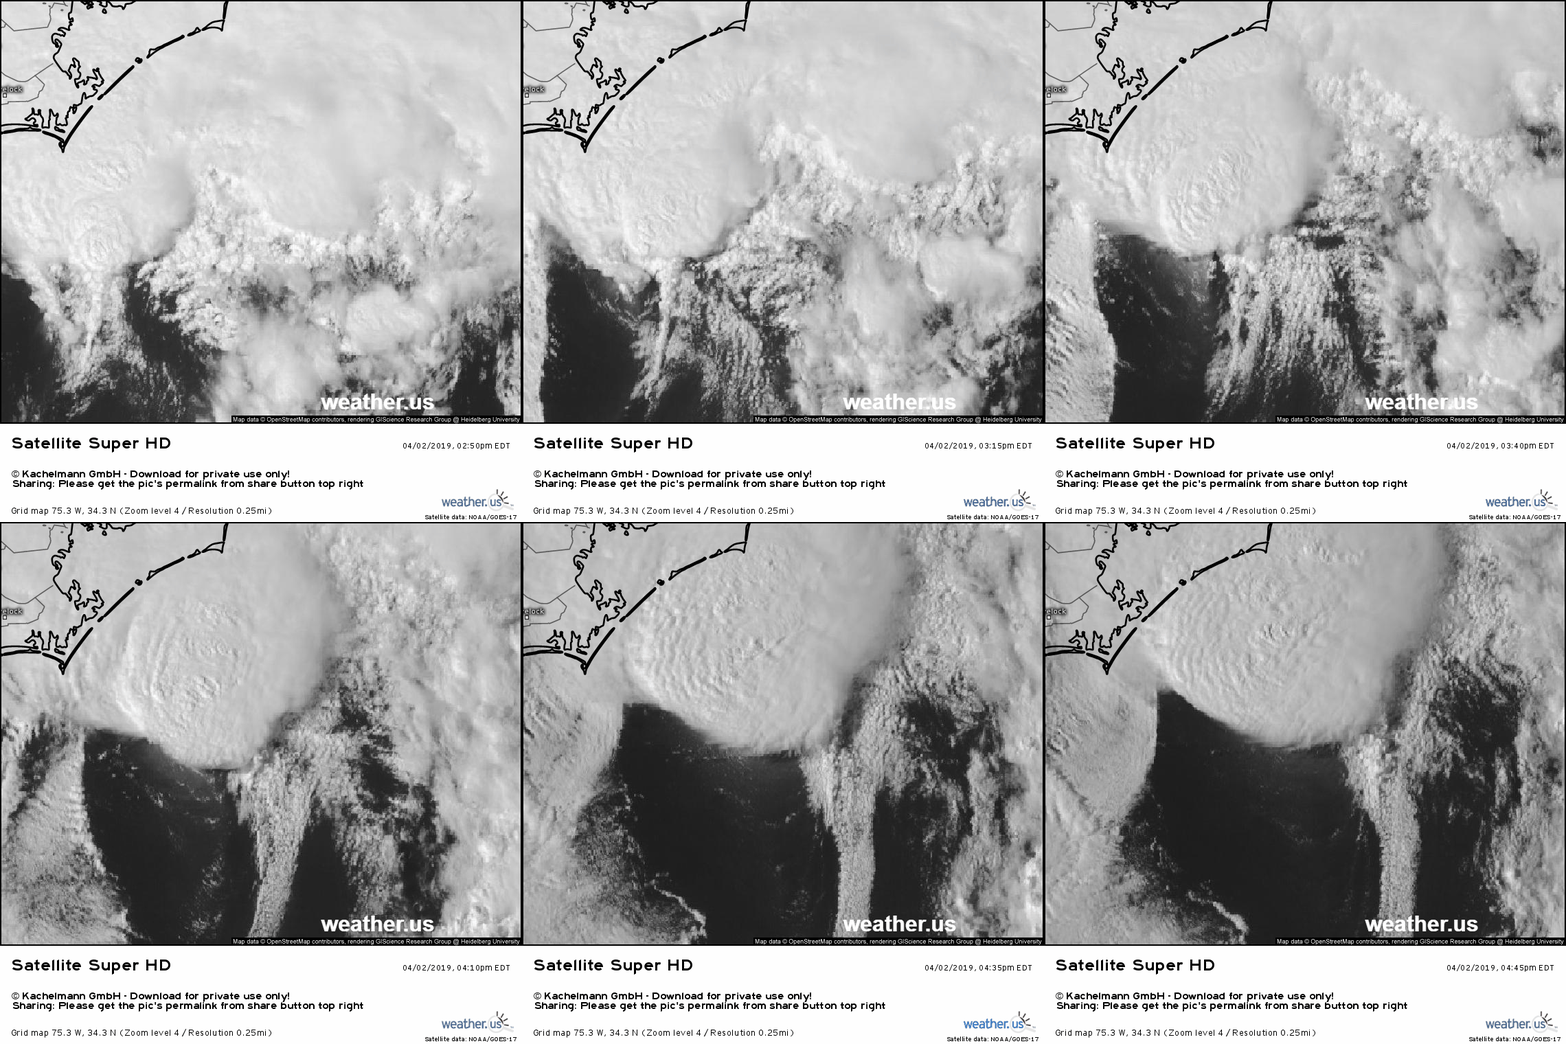
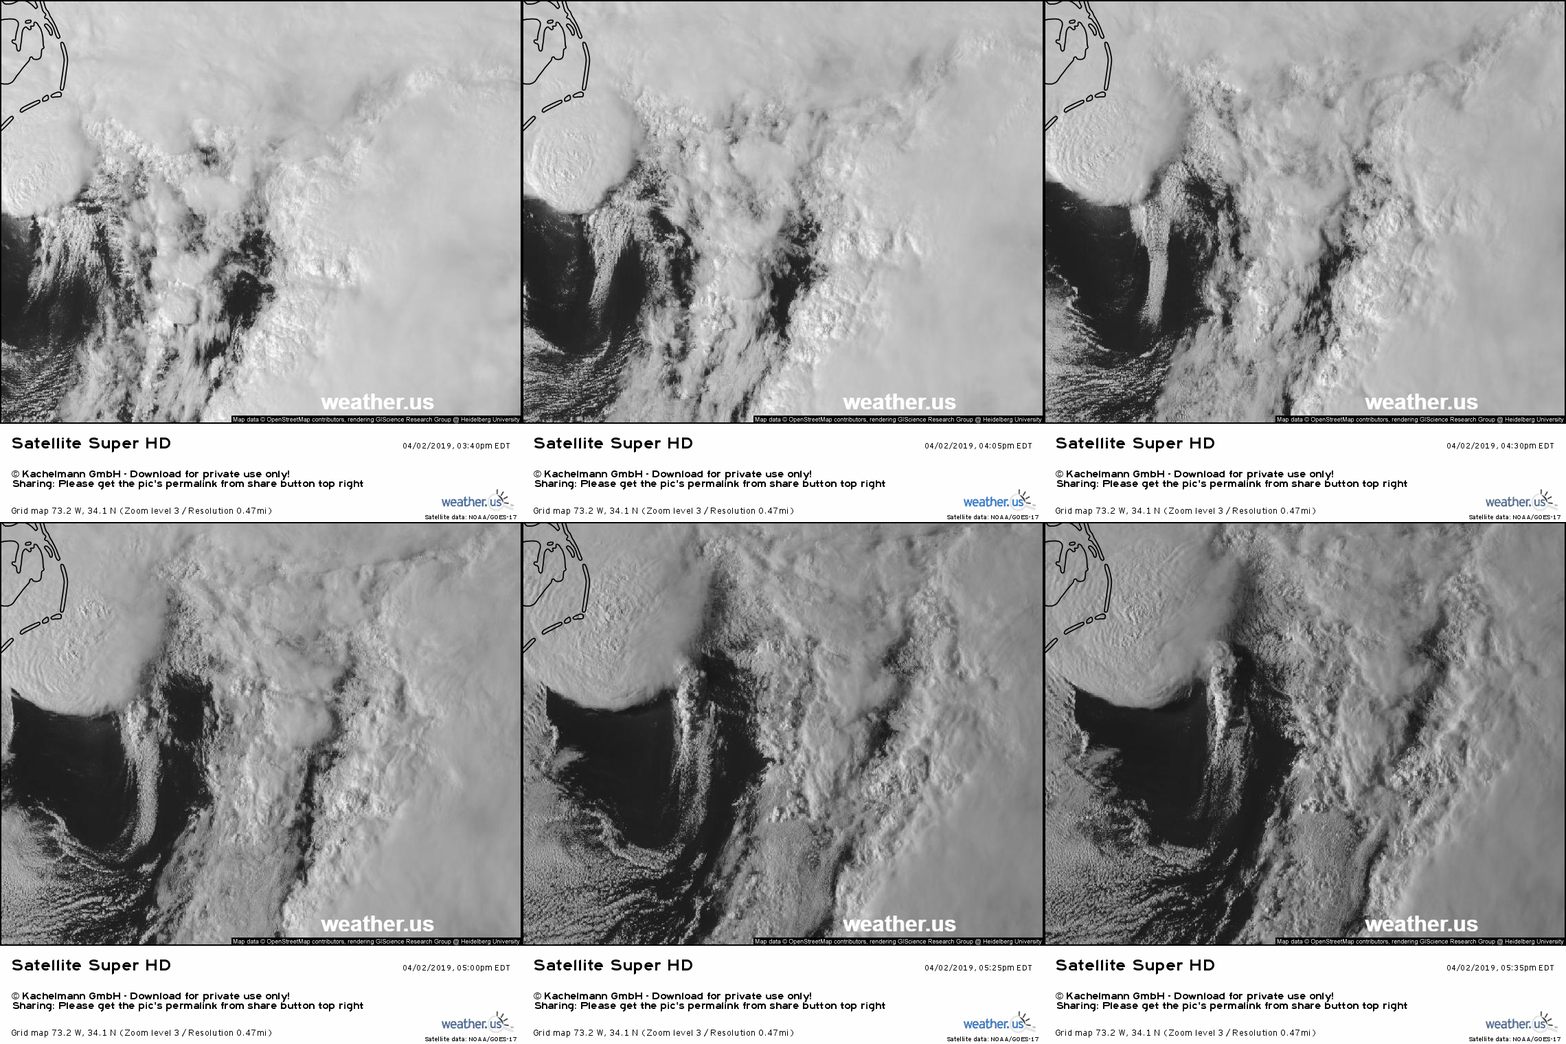
Further evidence of the sting jet can be found on visible satellite imagery via GOES-East. The center of the storm is hidden under the big thunderstorms near the center of the spinning clouds. Remember we’re looking for evidence of cool, dry, descending air just to the south west of the storm’s center. Watch what happens as the storm intensifies and the dynamics become stronger. Rapid clearing is observed southwest of the low, which is near the bottom right of the image. As the sting jet intensifies, the air in that region becomes drier, resulting in the evaporation of any clouds that were present before the jet arrived. Also note the new line of thunderstorms developing on the leading edge of that drier air, as the front of the sting jet becomes a forcing mechanism, causing the warmer and moister air not part of the sting jet to rise. This new line is also visible on the radar imagery above.
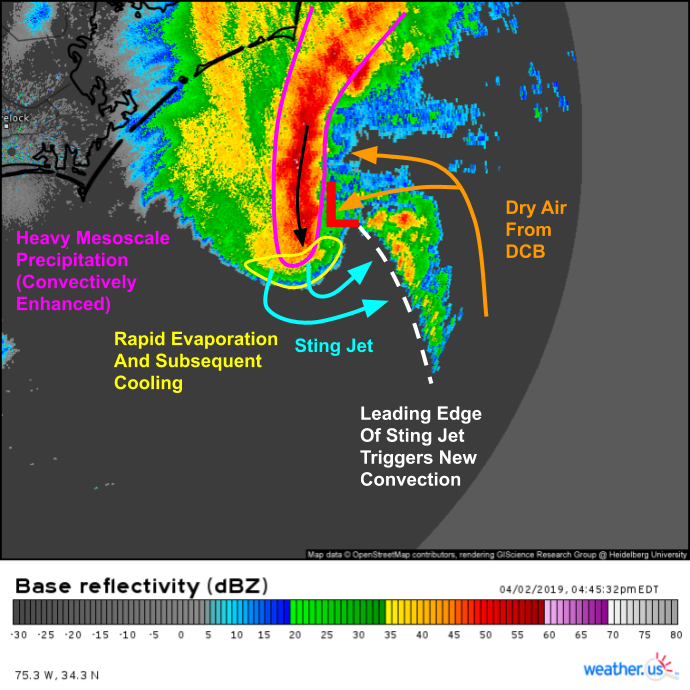
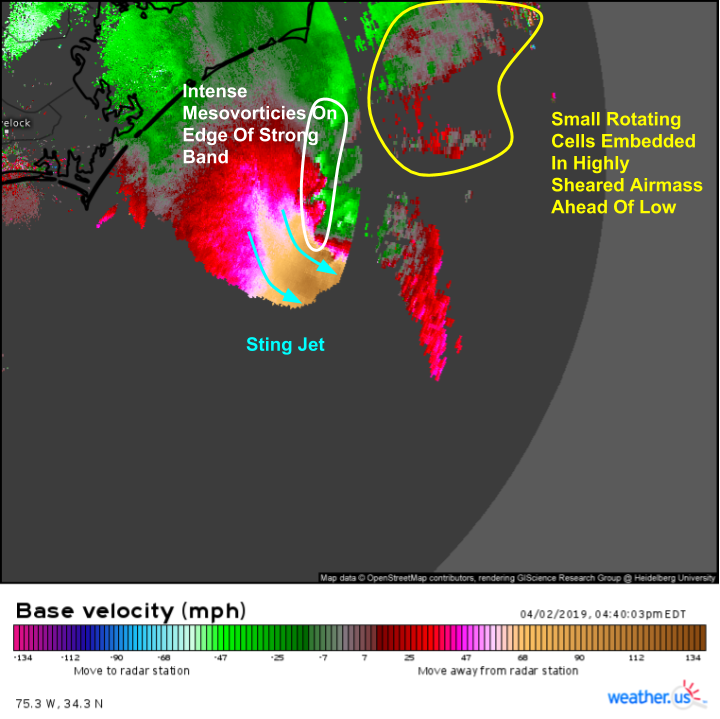
Here’s an annotated radar image from 4:45 PM EDT that highlights some of these processes. You can see the DCB (dry conveyor belt) wrapping around the southern side of the low (area without precipitation) and up around the eastern side of the low (also without precipitation). The band of heavy precipitation that results from mesoscale dynamics and the interaction between the warm and cold conveyor belts (plus a good dose of convective enhancement) is also clearly visible just NW of the low. As we saw in the radar loop above, cells near the low are moving south before disappearing into a point just SW of the low. That’s where we’re seeing rapid evaporation (powerful cells with intense rain evaporating into thin air within minutes) and also rapid cooling. That cool, dense air then rushes downward as the sting jet. You can also see where the leading edge of the sting jet is acting as a forcing mechanism for new convection SE of the low.
Here’s another satellite loop that puts the whole thing into a little more context. The main convective burst over/near the center is visible near the top left of the image, with the drying from the sting jet just below the strongest thunderstorm activity. The development of new storms along the leading edge of the sting jet is also visible, between that feature and the larger area of showers and thunderstorms located to the east associated with the primary cold front. GOES-East satellite imagery really is an amazing tool to be able to diagnose features like this!
The last visual I’m going to take a close look at is this image here. The data displayed are wind speeds inferred from the radar, either heading towards the radar on the coast in NC (green colors = inbound winds) or heading away from it (red colors = outbound winds). The first feature that’s immediately evident is the sting jet with its mid level wind values (the radar is sampling a few thousand feet above the ground in the area of the jet) well over 100 mph. Immediately north of the jet, we can see strong mesovorticies that look a lot like the couplets we see when hunting for tornadoes. Strong inbound winds are located very near strong outbound winds, hinting at rotation. If you were to be out in a boat in that area, you’d likely see (if it wasn’t raining too hard) some pretty impressive waterspouts (in addition to some very, very large waves).
Of course these aren’t the only cool dynamics at play with this system, but the sting jet often occurs so far out over the ocean that we can’t sample it with radar or super high res satellite imagery. Thankfully, the core of the jet will remain offshore so impacts will be greatly reduced compared to if that feature were to move over coastal areas.
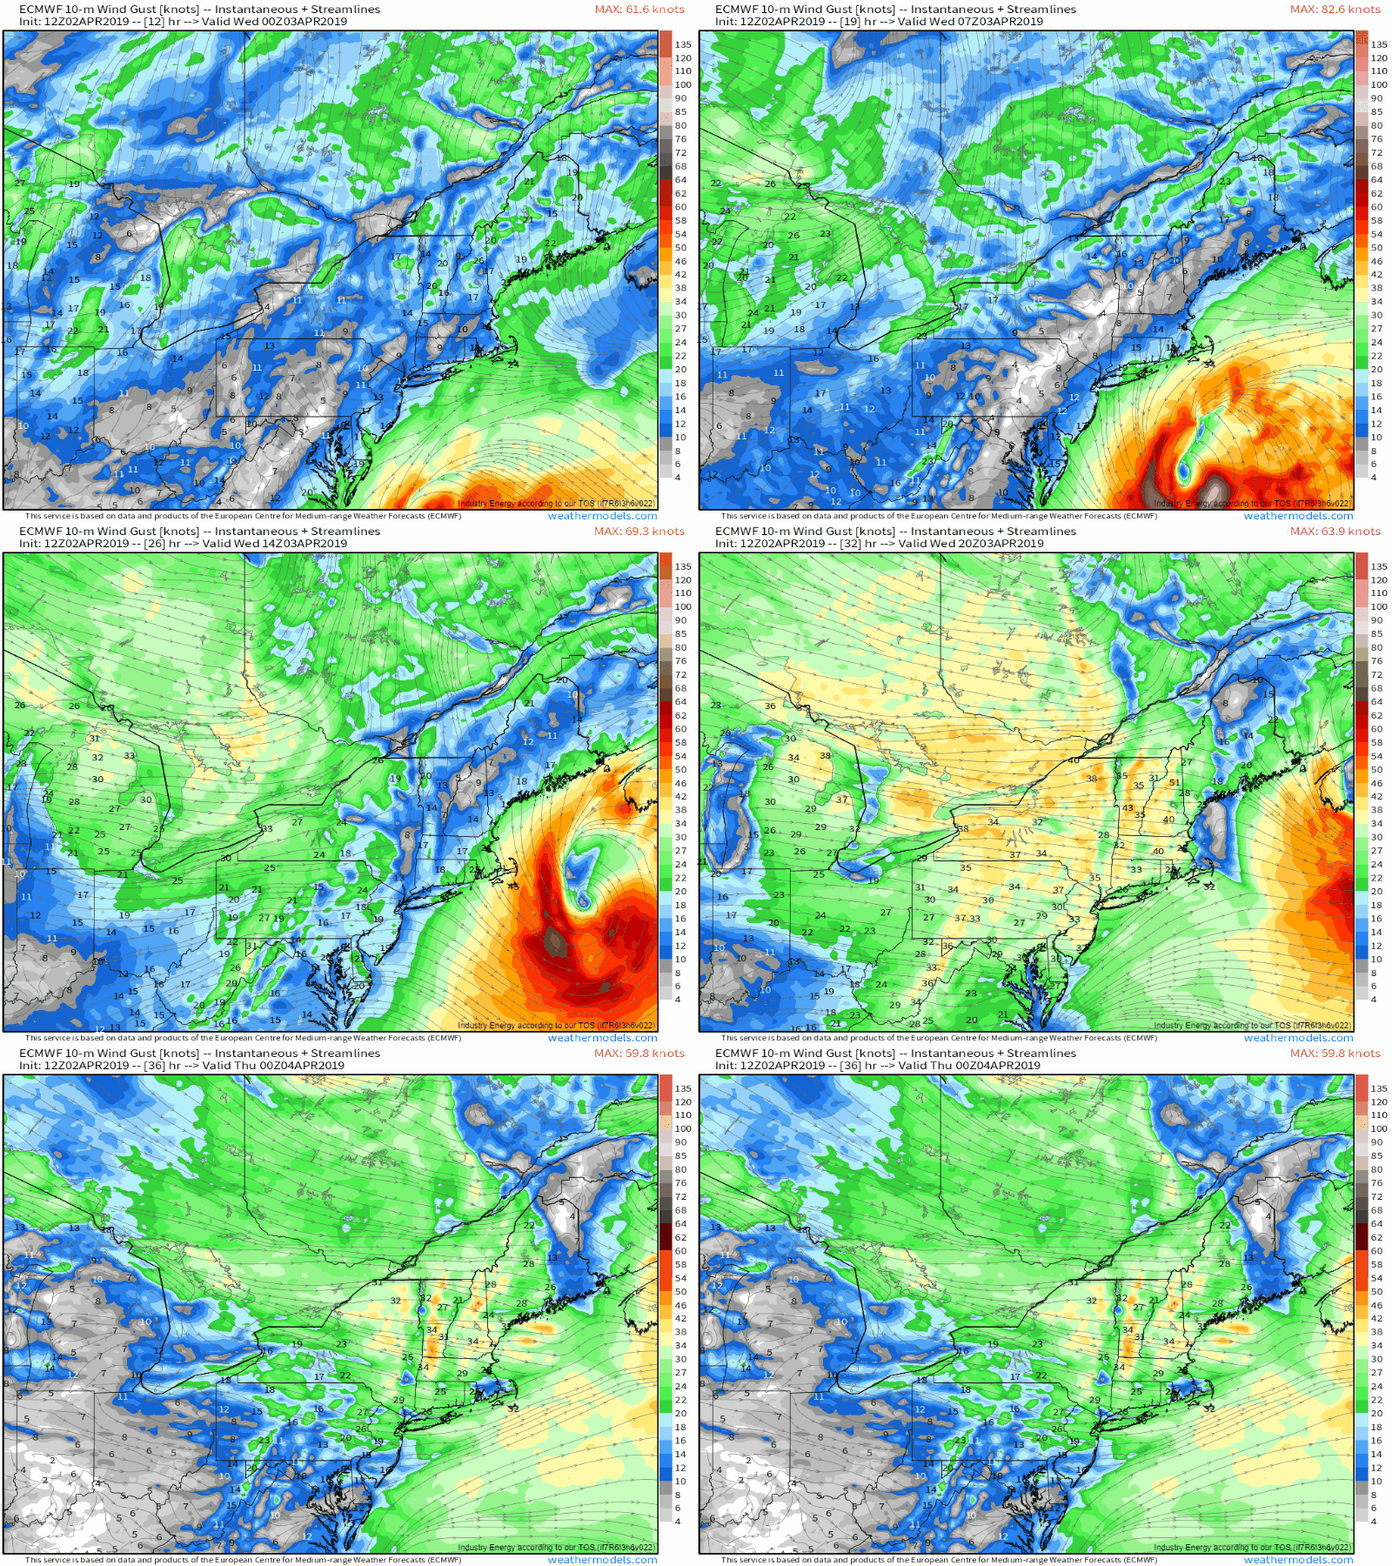
Here’s a look at the ECMWF’s forecast wind gusts for the next 24 hours, from 8 PM tonight to 8 PM tomorrow night. The sting jet is clearly visible to the south and southwest of the storm’s center, which thankfully will remain well offshore (though Cape Cod will get close enough to see some decent gusts). Most of us will see our strongest winds after the storm departs and a secondary cold front drops in from Canada, ushering in cooler and drier air. GIF via weathermodels.com.
I’ll have more thoughts and analysis on twitter, both @WeatherdotUS and @JackSillin. Our resident expert Dr. Ryan Maue will also be tweeting about the system @RyanMaue if you don’t follow him already. Feel free to interact with us and ask us any questions you may have!
-Jack
