A Closer Look At Ensembles: What Are They, How Do They Work, and Why Do We Need Them?
Hello everyone!
With a potential East Coast snowstorm on the horizon about a week out, today seems like a good day to revisit the topic of ensembles. I’ve produced several tutorial videos explaining how to access/interpret ensemble data at weather.us, but I realized that I never went into much detail regarding how ensembles actually work and what makes them so useful. That’s what this post will aim to do.
It’s no secret that numerical weather models have many flaws (I highlighted a few of them in the Model Mania series). Errors creep into the modelling process at every turn, and because the atmosphere is a chaotic and nonlinear system those errors grow exponentially with time. One of the most important sources of error in our models is related to incomplete initial conditions. We don’t have enough observations to know what each and every air parcel in the atmosphere is up to right now, yet we expect our models to come up with a forecast for each and every air parcel’s behavior over the next 7-10+ days.
To illustrate this issue, let’s examine the gap between what we know about temperatures in Wyoming at 7 PM on January 25th, 2020 and what the model thinks it knows about temperatures in the same place at the same time. If you look closely, you’ll see that the model seems to ‘know’ what the temperature is in a lot of places where there are no thermometers to tell the model what the temperature actually is. How does the model fill in these gaps? It has to make an educated guess. Some of the information it uses to make that guess might include elevation data, satellite imagery, and climatological information. At the end of the day, these guesses are really good but they’re not perfect. Given that an error of 1F in today’s Wyoming temperature might send next weekend’s East Coast storm in a completely different direction (ok maybe not, but similarly cascading errors happen all the time), it would be helpful if we had some information about what would happen if we told the model slightly different information about the temperature in Wyoming.
This is the basic idea behind ensembles. Instead of making our best guess about the temperature field in Wyoming and calling it a day, we’re going to make 50 different guesses, run an otherwise identical model starting from each different set of initial conditions, and see what happens. Of course we don’t limit ourselves to the temperature in Wyoming. Actual ensembles like the EPS (run by the ECMWF) and the GEFS (run by NOAA) incorporate differing guesses about what’s going on everywhere in the atmosphere.
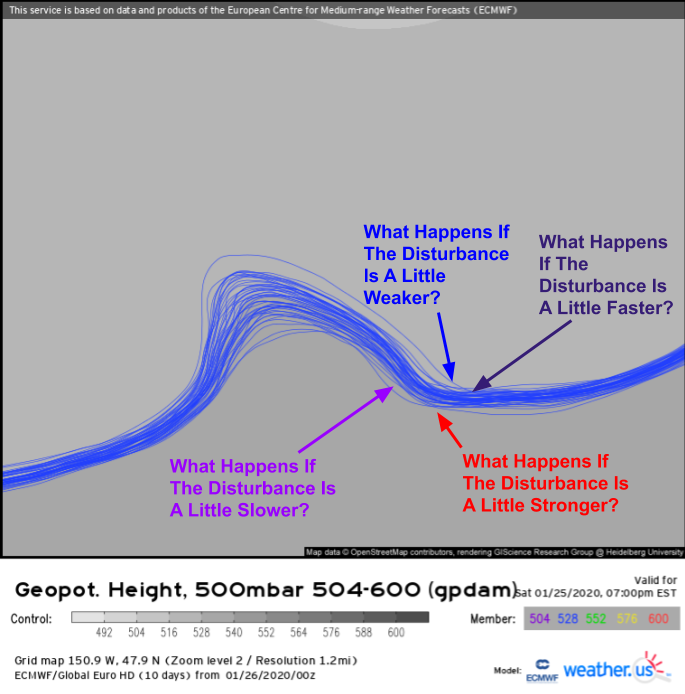
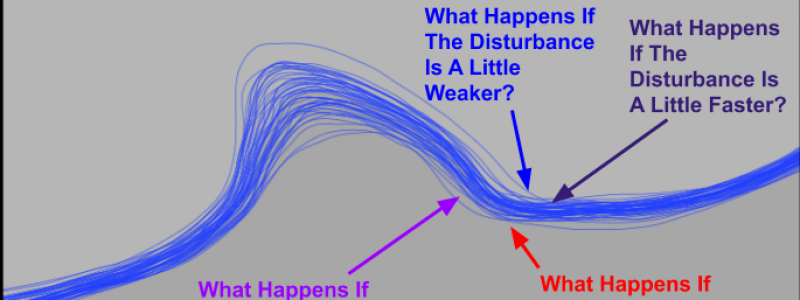
Here’s another example of ensemble perturbations (slight changes artificially added) to the initial conditions for the 500mb height field over the North Pacific.
This happens to be one of the disturbances that will contribute to the formation of next weekend’s storm system (if it does form). We don’t have any instruments that can tell us the height of the 500mb pressure surface in this area (no one launches weather balloons over the North Pacific and airplanes usually fly a lot higher over the open ocean) so we have to make our best guess based mostly on satellite data. That best guess is used for the deterministic ECMWF/GFS models. Then, we create 50 other possible versions of that same disturbance using ensemble perturbations. Some of these “what-if” disturbances will be a little faster than our best guess, some a little slower, some a little stronger, and some a little weaker. The goal is to capture the full range of reasonably possible disturbance characteristics then see what happens if the disturbance is a little faster/slower/stronger/weaker than we thought.
Unsurprisingly, if we add small perturbations to all the disturbances around the world, we end up with some radically different forecasts for next weekend. As with the previous map, each line here represents one ensemble member’s forecast for the height of the 500mb pressure level. As you can see, there might be a big storm (very low heights) south of Cape Cod, the storm might be closer to Indiana, or there might not be a storm at all. Tiny differences in what we think the atmosphere is doing now end up making huge differences in what we think the atmosphere will do later!
Update: several folks have reached out on twitter after I originally published this post informing me that while the suite of ensembles run by NOAA (GEFS) strictly perturb the initial conditions, the ECMWF ensembles also include perturbations to the series of governing equations that the model uses to calculate the forecast after it has received the initial conditions. At the end of the day, the idea behind both ensembles is the same, but the ECMWF ensembles attempt to quantify the uncertainty introduced by two sources of model error as opposed to just one. This is one of several reasons why ECMWF forecasts are generally more accurate than those produced with NOAA’s suite of models.
Hopefully by now you’ve gained a better understanding of what ensembles are (many different versions of the same model run with slightly different initial conditions) and how they work (we take our best guess of what the atmosphere is doing now and add small tweaks called perturbations then see what happens if we assume each perturbation represents reality). If you want to take a deeper dive into how I use ensembles to forecast long range storm threats, check out this post which takes a close look at the forecast for next weekend using lots of ensemble guidance.
If you want to check out some ensemble data for yourself, head on over to weather.us and/or weathermodels.com. We have lots available! If you want to learn more about how to find/interpret the ensemble data we have at either site, check out these tutorial videos.
-Jack

