The Science Behind The July 31st Microburst In Boston MA
Hello everyone!
On July 31st, 2019, a microburst impacted parts of downtown Boston MA as well as nearby Logan Airport, bringing winds in excess of 70 mph to a very highly populated area. Microbursts are fairly normal events, though it is rare (simply due to pure probability) to have one pass over the downtown part of a major city. With that in mind, this is a good time to take a look at microbursts and the science behind them, as well as what made conditions so favorable for microbursts in New England on July 31st (there were at least two more that afternoon farther north in parts of Maine). With a better understanding of what causes these damaging winds, we can be better prepared to predict when they might happen.
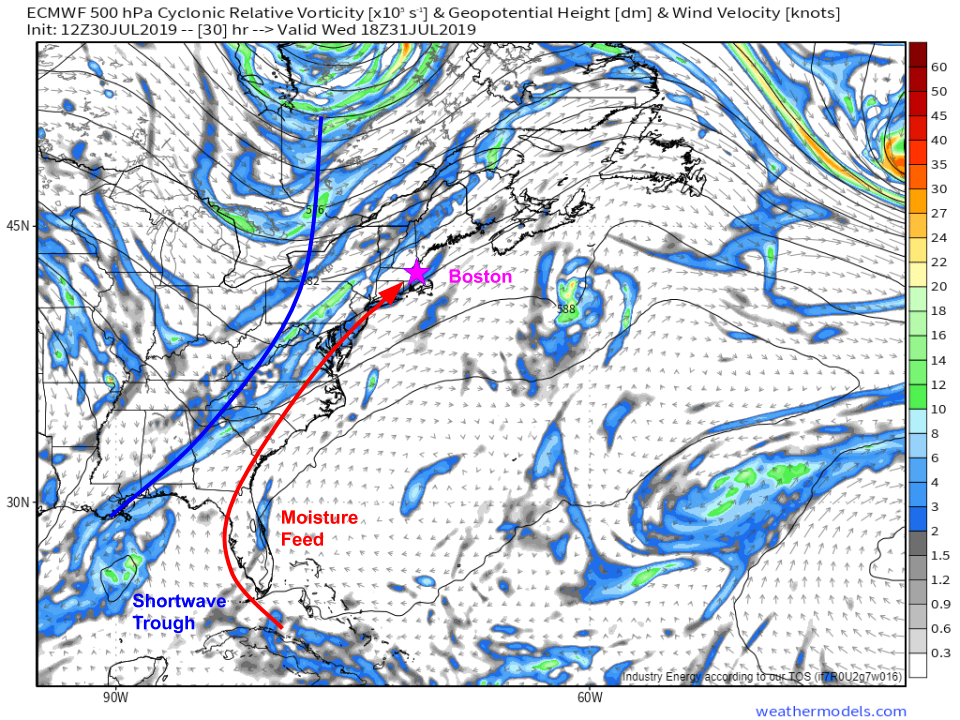
The overall setup going into the severe weather event across the East Coast more broadly on Wednesday is very typical of this time of year along the East Coast. A low pressure system way to the north in Hudson Bay dragged a shortwave trough (shown on the 500mb vorticity map above) and attendant surface cold front east through a warm and humid airmass provided by the Bermuda High. Map via weathermodels.com.
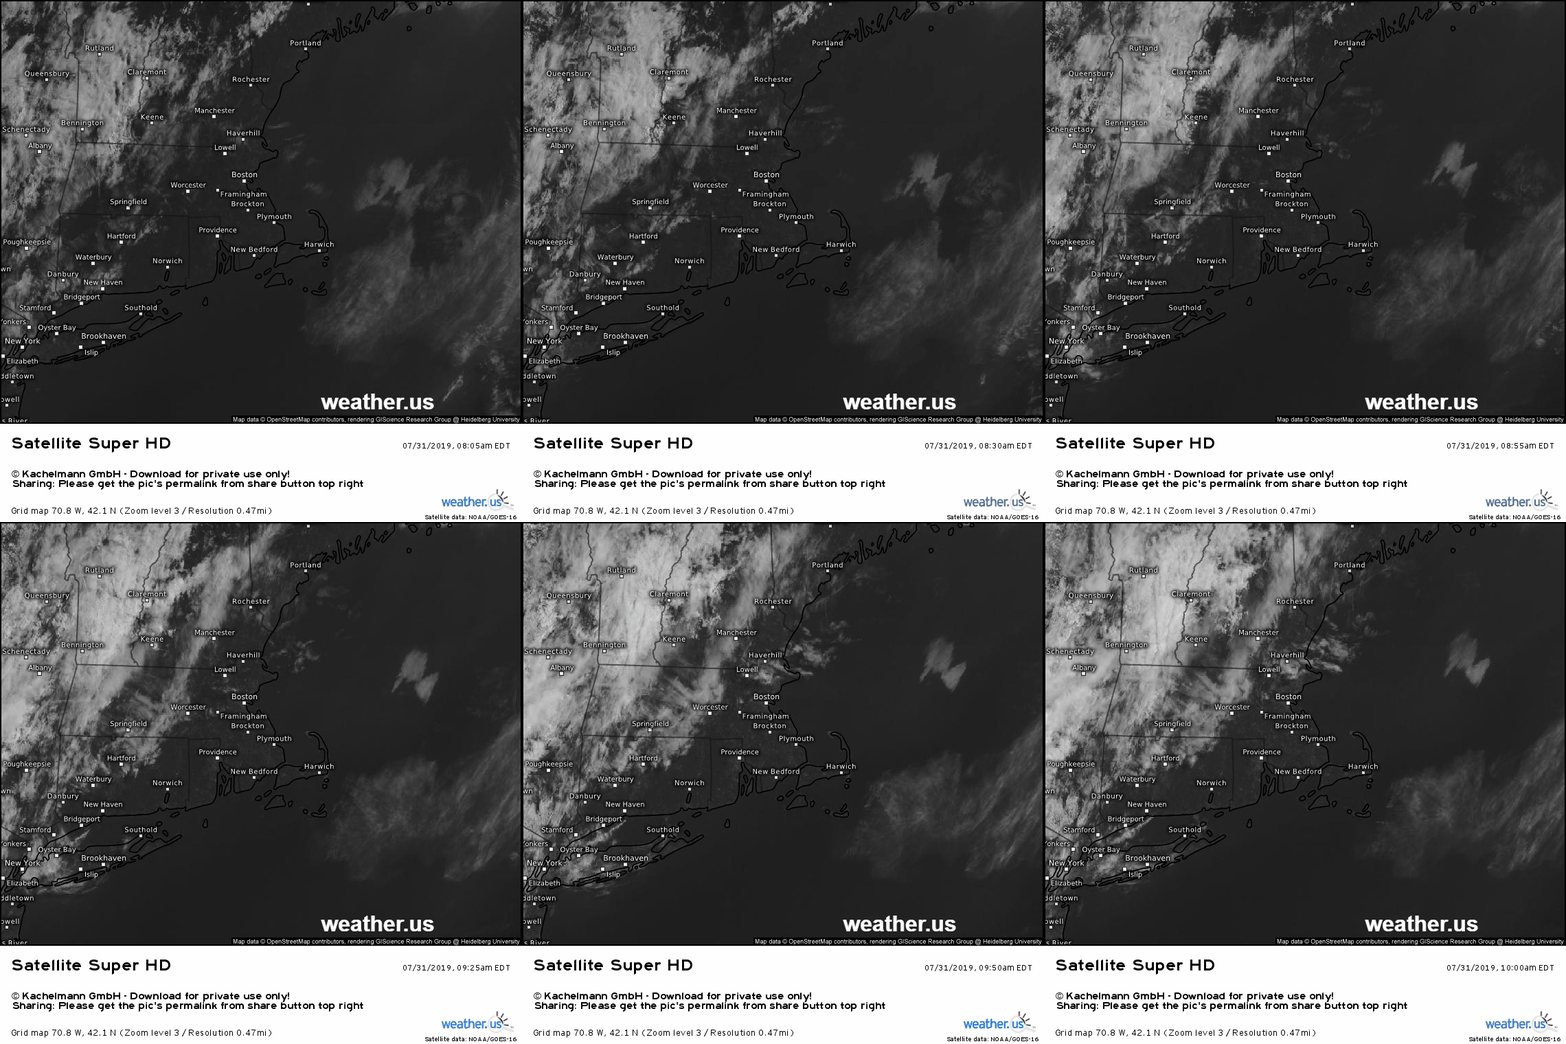
This is a loop of visible satellite imagery from a few hours before the thunderstorms that would go on to impact Boston developed. Note the lack of cloud cover over Boston and the surrounding areas. The strong July sun heated up the lower atmosphere unimpeded by clouds, which enabled the temperature at Logan Airport in Boston to rise to 94F before the storms arrived. The very warm temps are important to setting the stage for the microburst for two reasons. First, warmer air near the surface is more prone to rising rapidly upwards if it is ingested by an approaching storm (read more about convective instability here). Second, warmer air can hold more moisture. The amount of moisture in the air near Boston didn’t change much during the first part of the day, but as the air’s capacity to hold moisture increased, its relative humidity (how ‘full’ of moisture a given air parcel is) decreased. Before the storms arrived, the relative humidity in Boston was down to 37% which meant that the air near the ground was ready to absorb lots more moisture.
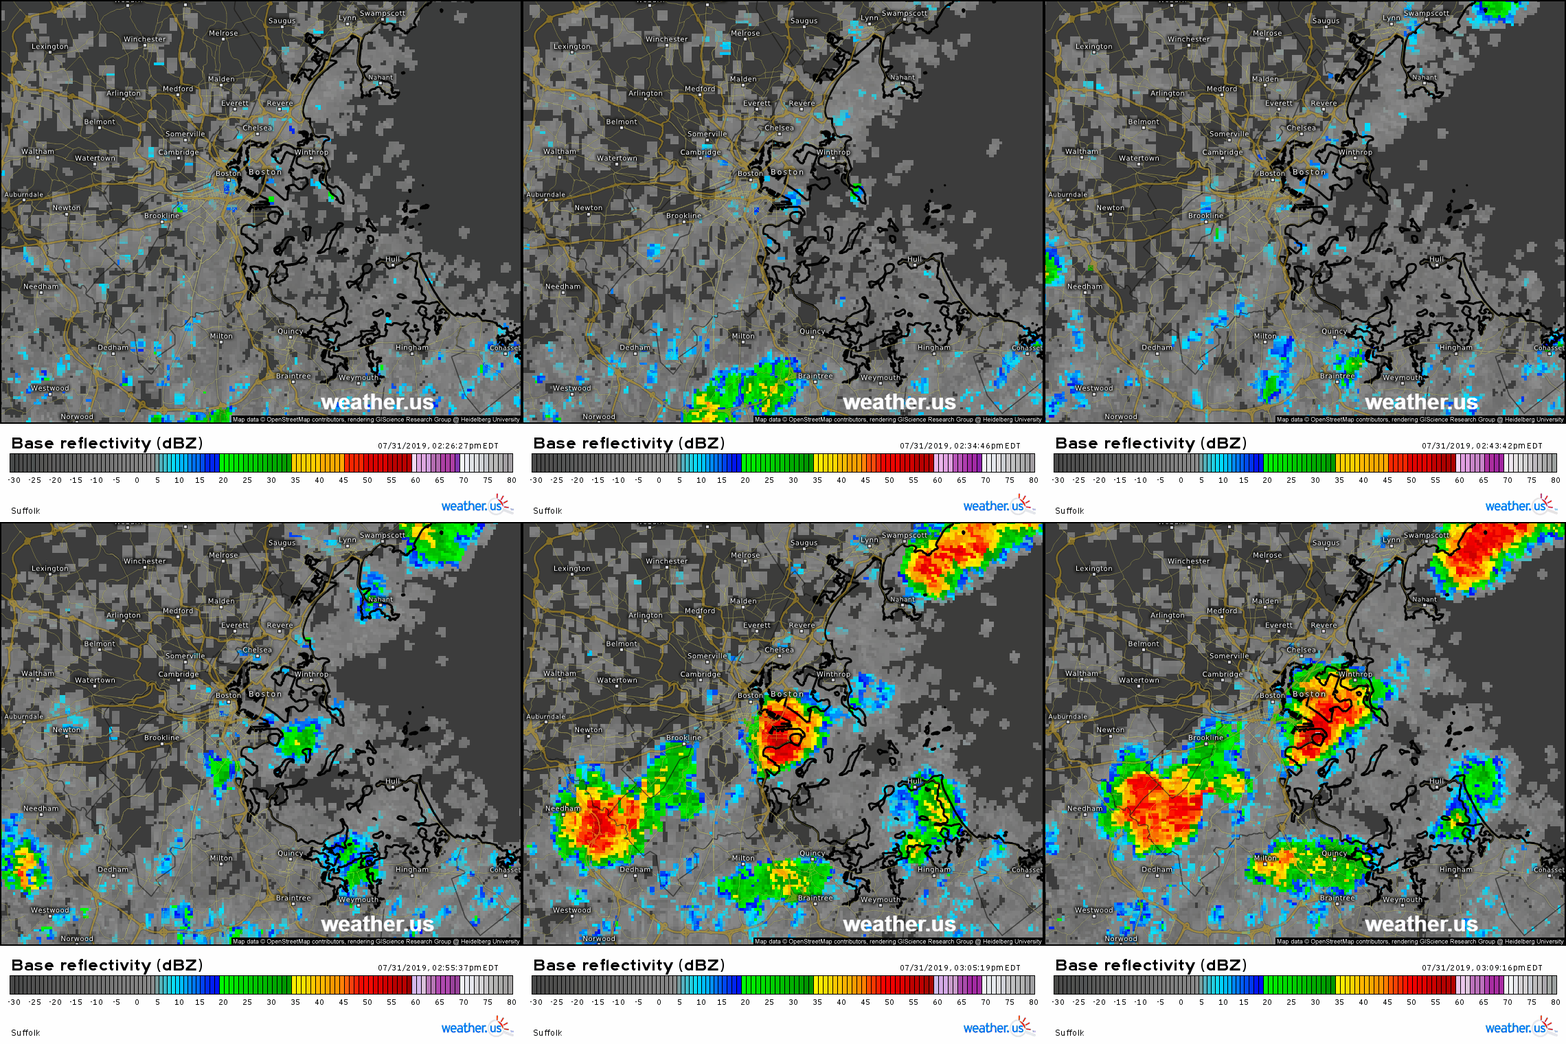
The moisture arrived around 3 PM as thunderstorms began developing along the a weak boundary shown in the radar loop above. The thunderstorms produced no shortage of raindrops due to the moisture-laden airmass just above the surface. That’s the process that began the chain reaction which eventually led to the microburst. 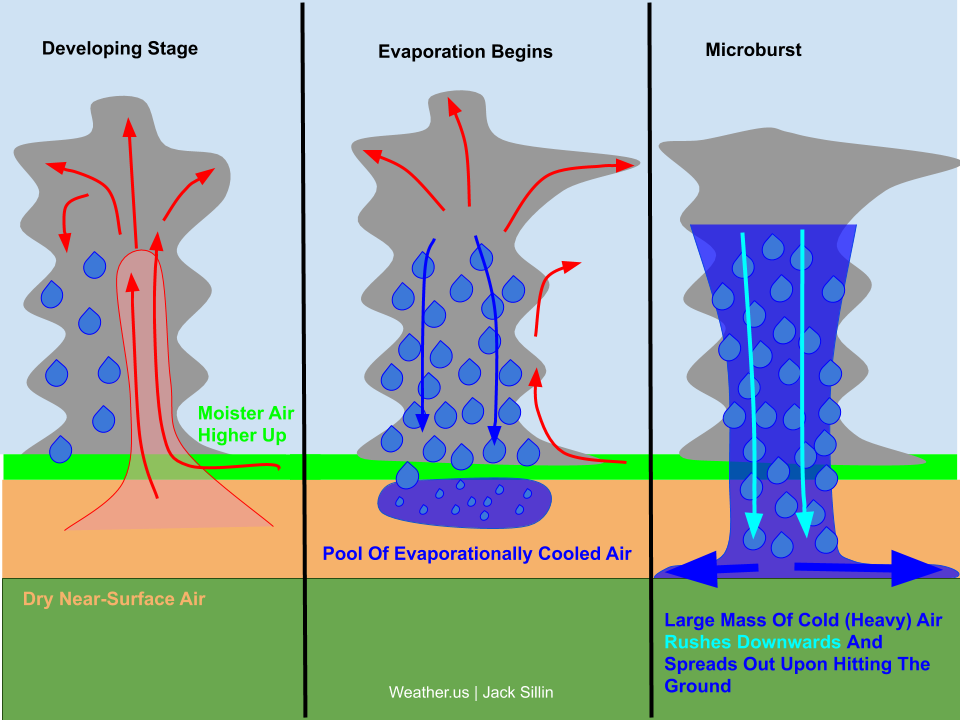
Here’s a look at that process from a schematic perspective. The developing stage is shown in the radar loop above. Warm/moist air rises, it accelerates upwards due to the density difference between warm/moist air and the relatively cooler/drier environment, and the moisture in the rising air condenses into raindrops. Eventually, those raindrops get too heavy to be supported by the updraft and they start to make their way towards the ground. This is where they encounter that area of relatively dry air (with the low relative humidity indicating that there’s plenty of room for more water). The raindrops then start evaporating to ‘fill’ the dry air’s empty water vapor capacity. This evaporation results in cooling, and thus the air in/below the storm becomes colder. Cold air is less dense than warm air, so the cold air then heads for the ground. As the blob of evaporationally cooled air crashes into the ground, it spreads out, resulting in very strong winds.
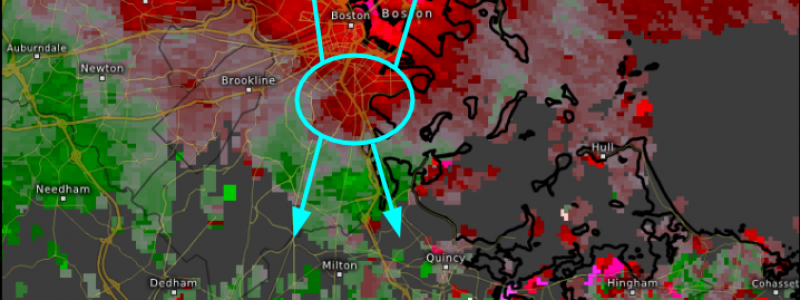
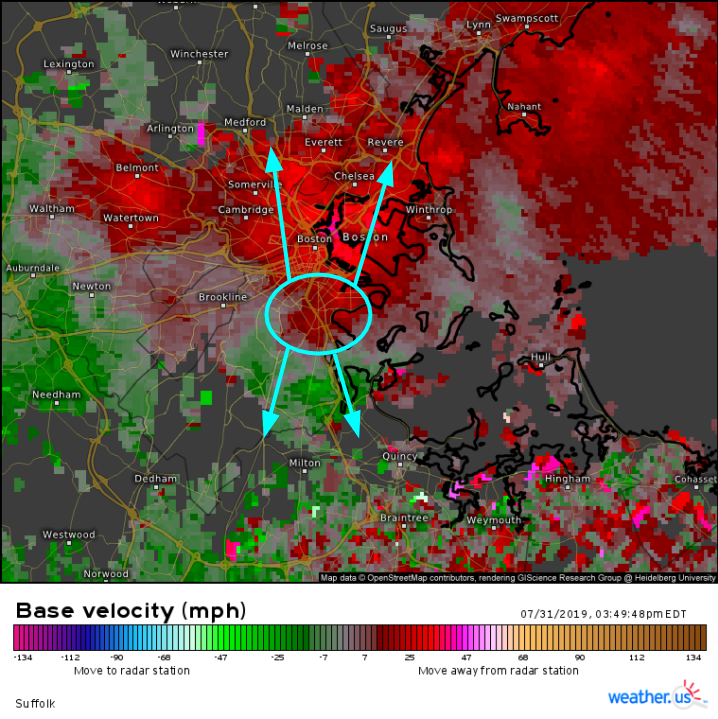
This process was visible over Boston on radar imagery just after 3:45 PM. The map above displays winds detected blowing towards the radar, located south of Boston, in green and winds blowing away from the radar in red. You can see that there was a strong signal of diverging winds (winds blowing in opposite directions) just south of Boston, with the city itself positioned in the region of strongest southerly/southwesterly winds. Strong northerly winds are visible just north of the suburb of Milton MA.
Some of the videos shared on twitter of the event were pretty amazing.
The weather station at Logan Airport reported a gust to 74 mph as the storm went through. Microbursts can produce some pretty intense wind!
Next time you have thunderstorms arriving with low RH values in the low levels, watch out for potential microbursts!
-Jack



Jack, the premise of your argument is that Logan was a Rel Hum desert and that propelled dry air to form the microburst. Study harder! Look at the dewpoint field and you will see your error. Think about how hard it would be to make this happen in the way you describe an it will make you a forecaster some day!
Hi Steve,
Thanks for expressing your concerns about my explanation. The problem with looking purely at the dew point is that it reflects only the absolute amount of moisture held by the airmass, not the amount of moisture relative to that airmass’s capacity. Evaporation doesn’t care about how much moisture there is, only how much space is left in the tank for additional moisture. Imagine the dew point was 64, as it was at Logan at 2 PM (before the storms arrived). If the temperature was also 64, the air would be saturated and no evaporation would occur. There might even be fog. All the rain falling into the top of the boundary layer would make it to the ground, as no evaporation would occur. If this were the case, the descending air in the downdraft would be adiabatically warming all the way down, which would reduce its negative buoyancy/downward momentum. In order to keep that air falling, you need evaporational cooling all the way to the ground to offset adiabatic warming and keep the pool of cold air cold. For further reading if you’re interested, consult this article by NWS Reno NV: https://nwsreno.blogspot.com/2015/06/draft-forecasting-dry-microburst.html