Understanding Late Season Thunderstorms In New England
Hello everyone!
An interesting weather phenomenon occurred Thursday afternoon across parts of Southern New England. Despite cool temperatures around 50 degrees, and a calendar that shows Thanksgiving just around the corner, strong thunderstorms developed, bringing lightning, hail, gusty winds, and rainbows. So what’s behind these storms, and how can we analyze them with the tools at weather.us?
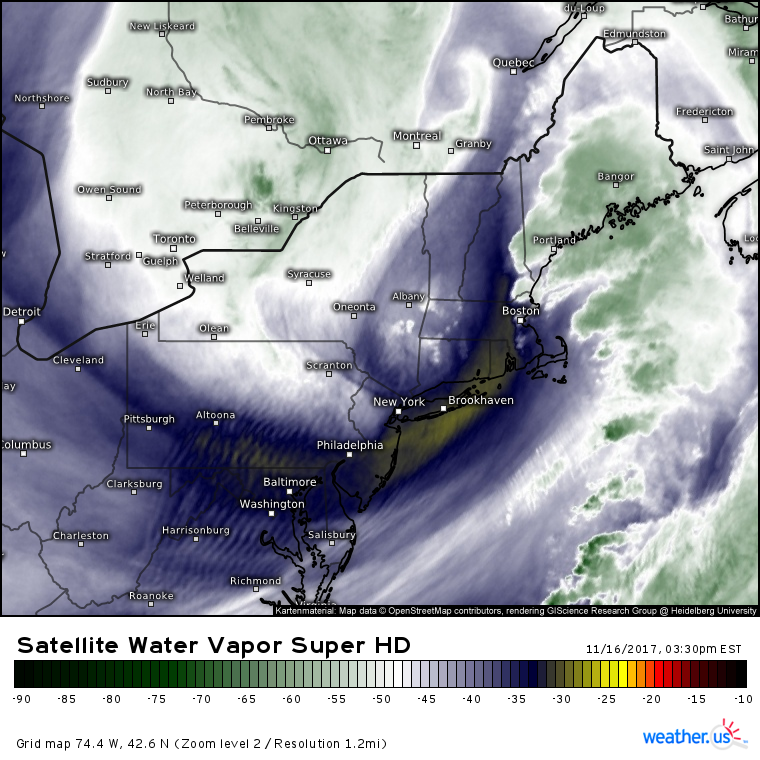
GOES-16 Water Vapor satellite imagery (what’s that/how do I use it?) shows a very strong upper level disturbance located near Poughkeepsie New York at 3:30 PM EST, as the thunderstorms were in progress. You can see the storms as the small speckled white patterns just northeast of the disturbance, ranging from Hartford to Springfield and back west towards Albany. Notice that only the areas just ahead of the disturbance (which was moving northeast) are seeing storms. The rest of the area saw clear skies, with steadier rain noted to the east towards Portland and Boston. Clearly this disturbance was an important factor in causing these storms to develop, but why?
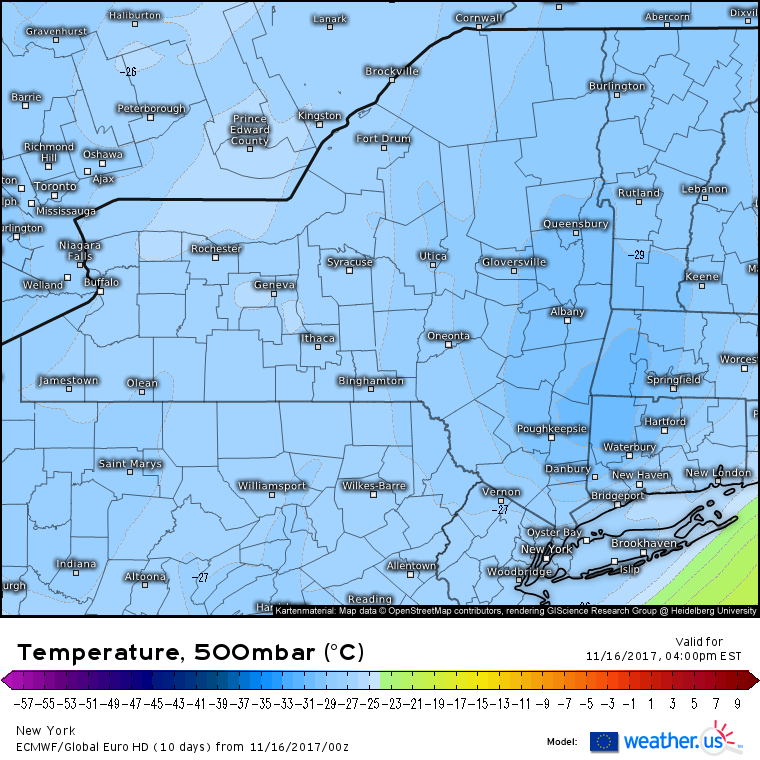
This is a map of the temperature in the middle of the atmosphere, where the pressure is 500mb (it’s usually just over 1,000mb at the surface, though that obviously varies quite a bit from place to place and day to day). Notice the location of the pocket of very cold temperatures at 4 PM: directly over the area that was seeing storms, from Poughkeepsie east to Hartford and north to Springfield. Mid/upper level disturbances are associated with unusually cold temperatures aloft. Why is that important for thunderstorm development?
This is a map of CAPE during the time of the storms. CAPE stands for Convective Available Potential Energy, which is basically how much fuel there is in the atmosphere for thunderstorms. Notice that the elevated CAPE values (above 100 J/kg) are located under the core of the cold air aloft. Why is this? One of the factors that influences CAPE is how fast the temperature changes with height, a quantity known as the lapse rate. A large vertical temperature gradient is one of the things that can contribute to high CAPE values. For more about CAPE, check out this explanation. While surface temperatures were only mildly warm, the cold air aloft secured a gradient sufficiently steep enough for storms. CAPE values between 100 and 500 J/kg are not especially high, but they were just high enough given the other dynamics in play.
The upper level disturbance didn’t just provide the fuel for thunderstorms via the strengthened vertical temperature gradient, it also provided the trigger to get air parcels rising. Remember the cold pool aloft that we discussed earlier? The leading edge of the cold pool acts like a cold front, with colder air forcing warmer air to rise as it moves in. This rising motion provided the trigger needed to fire up some storms that would end up bringing high winds, heavy rain, lightning and hail.
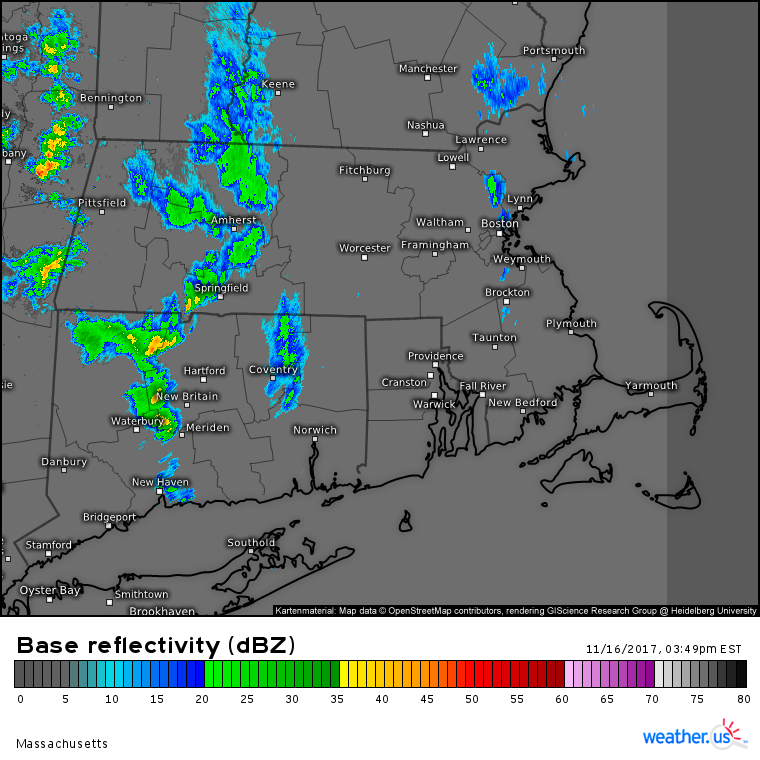
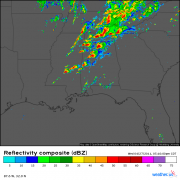
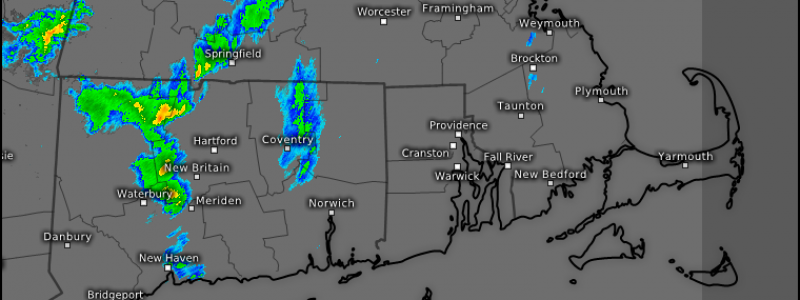
Here’s a radar image of the storms at 3:45 PM, near their peak intensity. This image from the Albany radar shows the storms near Albany in the greatest detail, the radar from Long Island was able to pick up a clearer picture of the Connecticut storms. If you find this archived radar imagery cool, be sure to explore the rest of our nationwide radar archive that extends back to 1991!
Now that you know more about these storms and what factors led to their development, be sure to watch our forecast maps closely for signs that an equally strong upper level disturbance might be headed your way. If there’s enough instability, you too may get thunderstorms!
-Jack
