Will The Midwest’s Rainy Pattern Ever End?
Hello everyone!
For the past several months, the central part of the US has been stuck in a very active weather pattern. The region has seen precipitation totals soar well above normal, which has numerous impacts including flooding and delayed crop planting. In this post, I’ll take a quick look at the pattern for the next week or two using our EPS tools at weathermodels.com to see if that wet pattern might continue, or if waterlogged parts of the heartland might finally get a break.
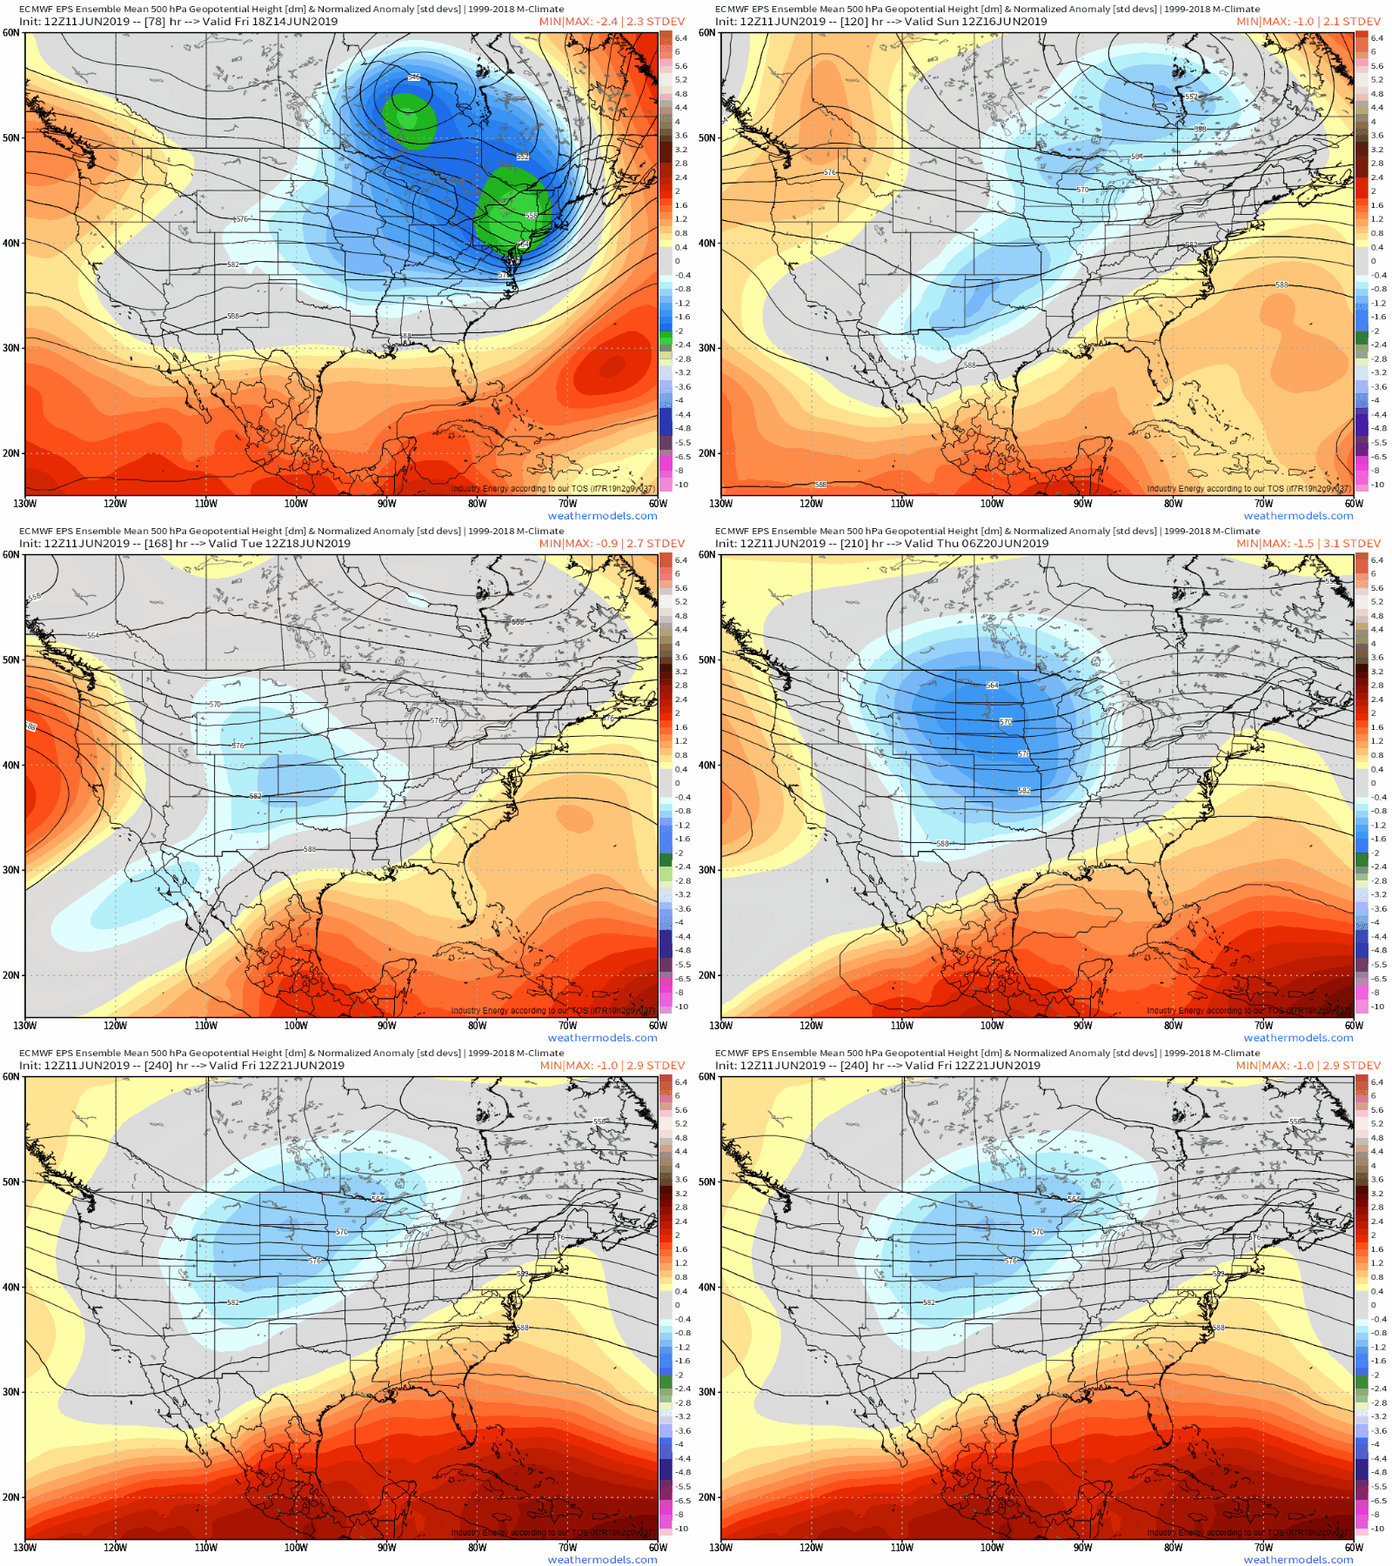
The forecast for 500mb height anomalies is a good indicator of what the overall pattern might look like. This loop shows the average of all 51 EPS members, meaning it smooths out some differences between possible scenarios forecast by individual ensemble members. This means that while the mean scenario is unlikely to happen verbatim, it does do a good job of pointing towards general trends. In this case the teo general trends to watch for are the area of below normal heights in the Plains, and the area of above normal heights in the Southeastern states. Unfortunately, that’s a background state favorable for active weather as little disturbances rotate around the base of the trough anchored in the Dakotas.
The presence of disturbances alone isn’t necessarily a slam dunk for heavy rain. Air can rise all it wants, but if there’s no moisture to condense on the way up, there will be no rain. So what might moisture levels look like?
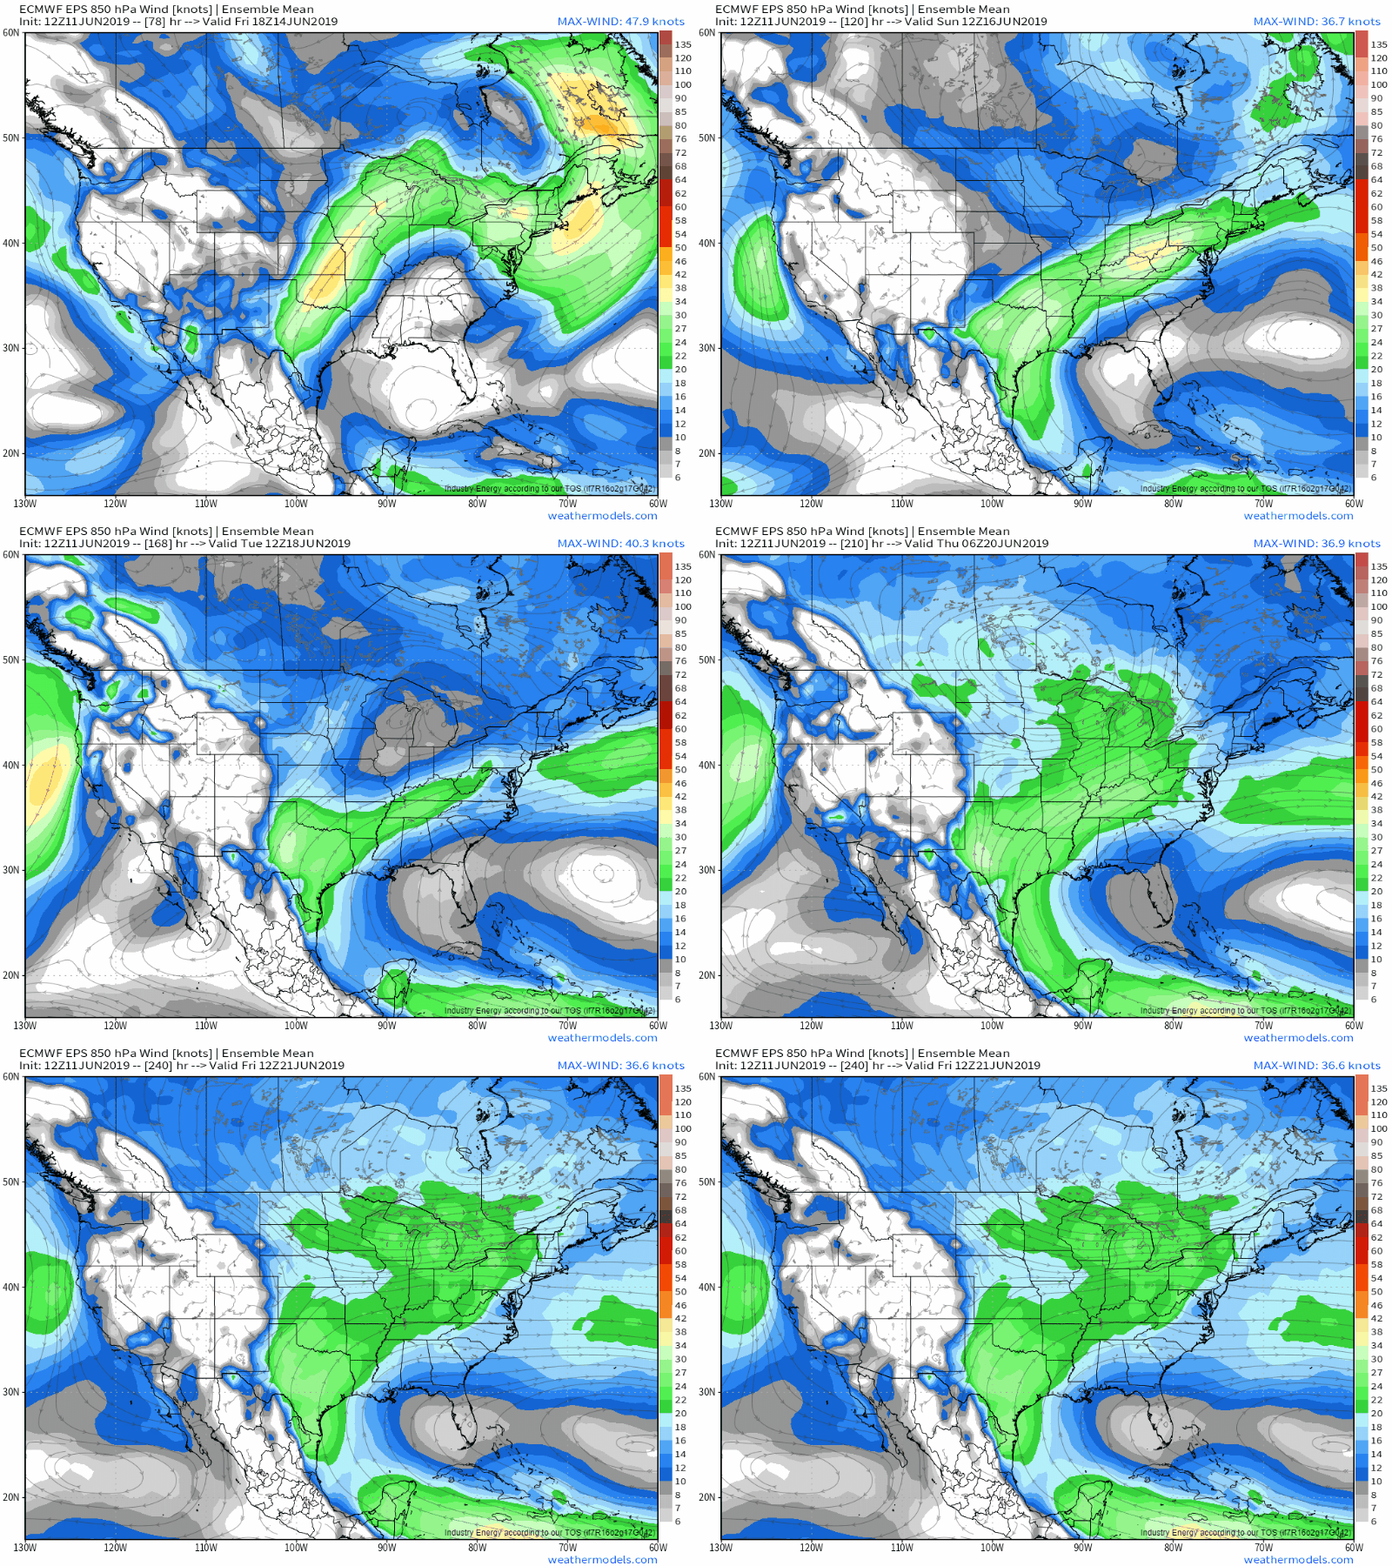
We don’t have direct moisture forecasts for the EPS like we do for the high-resolution deterministic ECMWF model, but we can make a pretty good guess based on low-level wind patterns. Winds coming from Canada would be generally dry, while winds from the Gulf of Mexico can be assumed to carry at least some moisture. The loop above shows the wind forecast for about 5,000 feet above the ground over the 3-10 day period. Note the persistent band of higher winds extending from the Caribbean through the Gulf of Mexico and Texas right into the southern Mississippi valley. That low level jet will be held in place by a strong high pressure cell south of Bermuda, and will be supplying plenty of moisture to the southern side of those upper level disturbances.
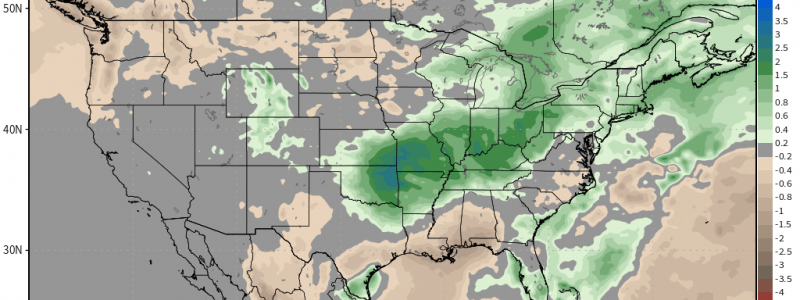
While we can’t figure out where individual thunderstorms will develop, and thus exactly how much rain can be expected for a given location, the EPS ensemble mean precipitation anomaly product shown here does a good job highlighting what can be expected to result from the pattern outlined above. More above-normal precipitation can be expected right where that upper level trough meets the low level southerly winds carrying Gulf moisture.
While the answer to the question posed in this post’s title will eventually be ‘yes’, it looks as though we won’t get to see that pattern change for a little while longer. If you live anywhere from Oklahoma all the way up the Ohio River valley, it’d be wise to keep the sandbags on standby as we work our way deeper into June.
Want info specific to your location? Try the city charts tool at weathermodels.com, or any of our point forecast tools at weather.us. Remember to look at not just the most likely outcome, but also the full range of possible outcomes especially if you’re peering more than 5-7 days into the future forecast.
-Jack
