Tropical Update: Will The Atlantic Wake From Its Slumber?
Hello everyone!
This is part two in a two part discussion of the tropical Atlantic. Part one looked at why the Atlantic has been so quiet during the month of August. It discussed several factors that contributed to the quiet pattern, and explained why they were bad for tropical cyclone development. If you haven’t already, please give it a read as this post will make much more sense if you understand what has been going on, and thus what the forecast changes I’m discussing are relative to.
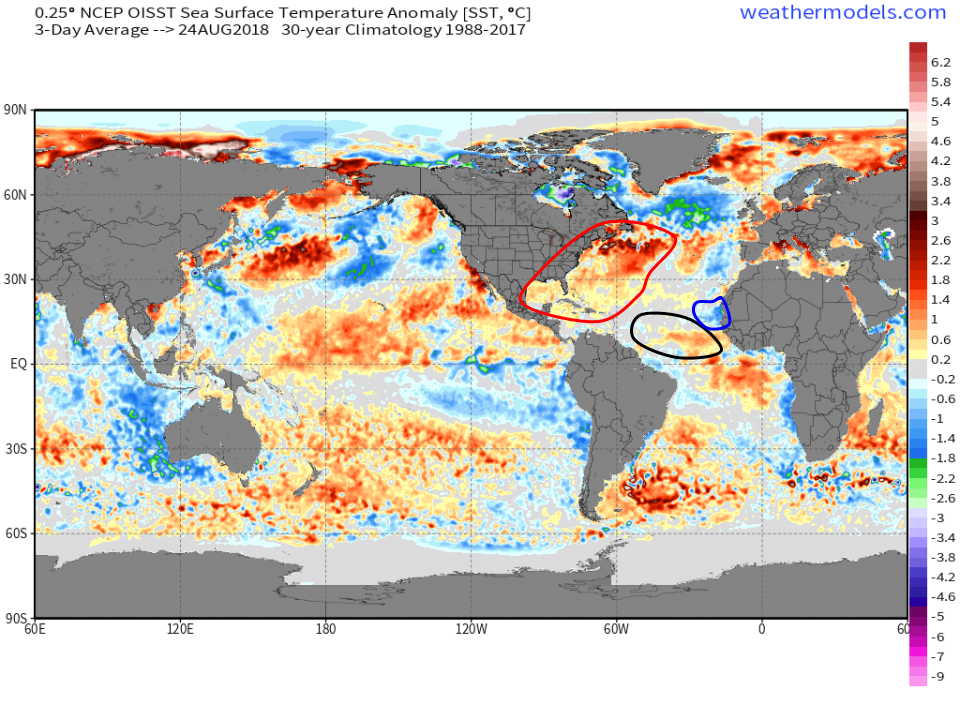
I’ll begin with the factor that often changes the most slowly, and arguably is one of the most important- sea surface temperatures (SST’s). A large area of positive SST anomalies exists across much of the Western Atlantic, from the Gulf of Mexico up to Nova Scotia (highlighted in red). This has been the case for much of the season so far, but if you remember from part one, there was a large area of cold SST anomalies in the deep tropics (between Africa and the Windward Islands). This has now been replaced by neutral/warm anomalies, as seen in the latest analysis (highlighted in black). The area of meaningful cold anomalies is now confined to a very small area just off the African coast (blue circle). As a result, the previously very unfavorable SST pattern will no longer be suppressing tropical cyclone activity.
Saharan dust is another factor that has been contributing to a quiet Atlantic during the month of August. Latest forecasts from the ECMWF’s Copernicus Atmospheric Monitoring Service (CAMS) shows the previously stalwart Saharan Air Layer (SAL) plume fragmented and weak by day 5. As with the SST’s, the pattern that was actively helping to suppress tropical cyclone activity a few weeks ago now shows signs of becoming much less disruptive to TC’s. Note that this doesn’t necessarily mean we’re in for a barrage of tropical cyclone activity, it just means that the overall pattern is no longer unfavorable.
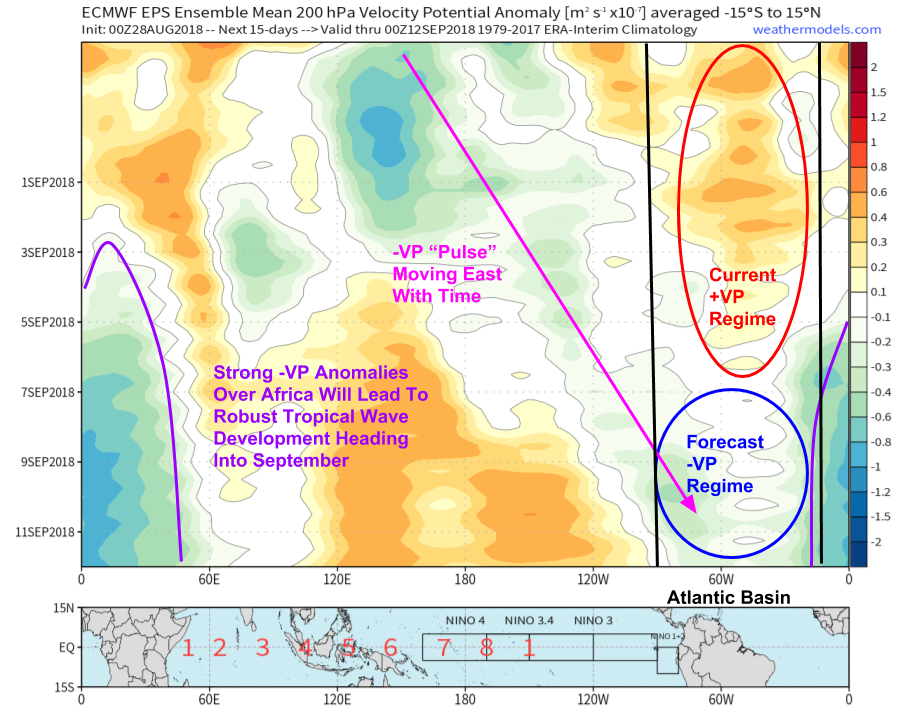
This plot, of Velocity Potential (VP) anomalies, from the weathermodels.com commercial site (available for pre-beta testing the week of 8/27, Contact Dr. Ryan Maue for inquiries/details), highlights some upcoming changes to the overall circulation pattern across the tropics worldwide. This type of plot is known as a Hovmoller, with longitude on the x-axis and time on the y-axis. This allows us to see the changes in patterns over a certain area over time, with the pattern in this case being large scale rising/sinking motion from negative/positive VP anomalies (respectively).
Note in the Atlantic how positive VP anomalies (large scale sinking motion generally favored) are set to be replaced by negative VP anomalies (large scale rising motion generally favored). This means that the atmosphere is set to go from generally suppressing thunderstorms to generally supporting them. Note that this is a pattern on the scale of entire basins, and synoptic conditions over any one part of the basin will determine if an individual disturbance actually becomes a storm or not. However, the weakening of the unfavorable pattern, and perhaps the emergence of a favorable pattern, argues in favor of a transition away from complete calm, even if that doesn’t end up meaning an outbreak of storms.
How can we be confident in this forecast? The short answer is that we only really can be to a certain extent. Week 1-2 forecasts are always going to carry some uncertainty, simply given the chaotic nature of the atmosphere. However, notice the general pattern in the features on the VP plot. They generally move from west to east with time. So the pattern in the basins to our west (Pacific) are likely to make their way over here eventually. The Pacific has been extremely active over the past week, with two typhoons making landfall in Northeast Asia, and three storms in the Eastern Pacific, Lane, Miriam, and Norman. Of course, the tracks or impacts of each of these storms depends on the synoptic conditions surrounding it, which we cannot necessarily extrapolate to the Atlantic, but the point is that there’s been some activity over there, and that activity is likely to spill our way over the next few weeks.
So what about that activity, are there any signs of it on operational weather models? The answer is yes, the ECMWF, GFS, and GEM have all spit out tropical storms of some type over the past couple runs. However, because these models are known to get the tracks/intensities of individual systems very wrong at this range, I’m going to stick with the EPS (Ensemble Prediction System), and show you how to use ensemble data to hone in on specific areas that need to be watched for development, without using the often unreliable operational models.
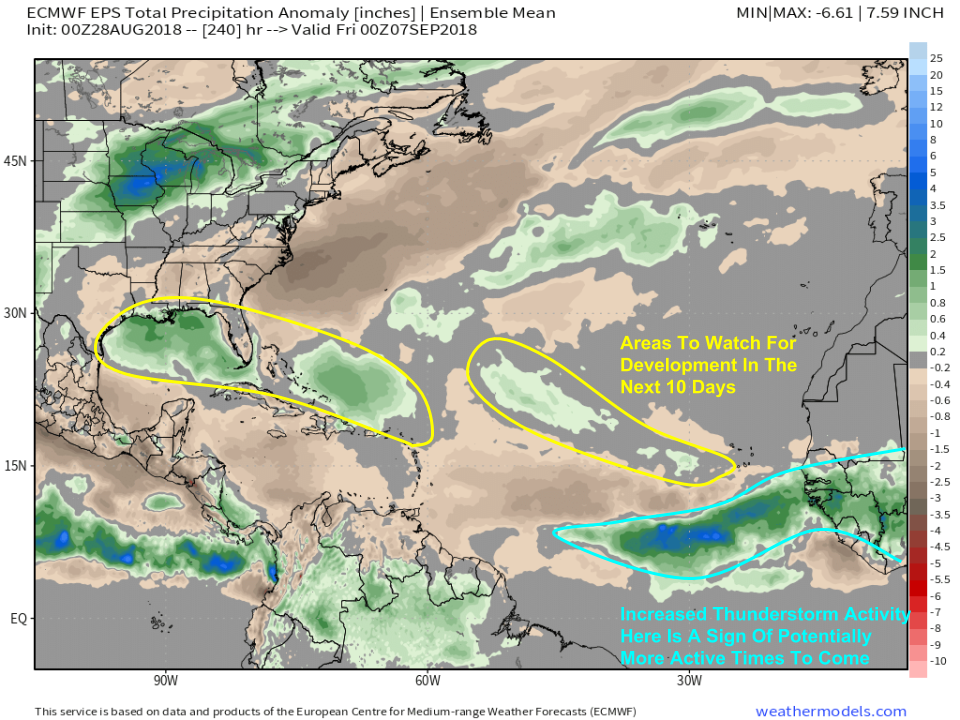
The first product to look at is the total precipitation anomaly product, shown above. In the tropics, this can be used as a proxy for thunderstorm activity. Because precipitation in the tropics comes (almost) exclusively from thunderstorms, more precipitation means more thunderstorms (note that this doesn’t work in the mid latitudes, where stratiform, or non-convective, precipitation is common). Concentrated areas with unusually high thunderstorm activity are good spots to watch for potential tropical cyclone development, given generally favorable conditions otherwise (warm SST’s, not too much dust, etc.). I’ve circled the two areas that show up especially clearly to me on the map above.
The area of strong positive anomalies near/off the African coast indicate stronger-than-normal activity in the Inter-Tropical-Convergence-Zone (ITCZ), a permanent feature of the tropics that shifts position seasonally. While not a specific disturbance to keep tabs on, an active ITCZ is often a precursor to more tropical cyclone activity nearby, as it reflects large scale upward motion (remember those VP anomaly changes!) that supports enhanced thunderstorm activity.
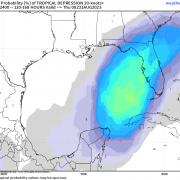
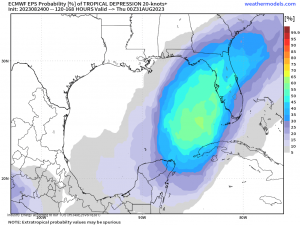
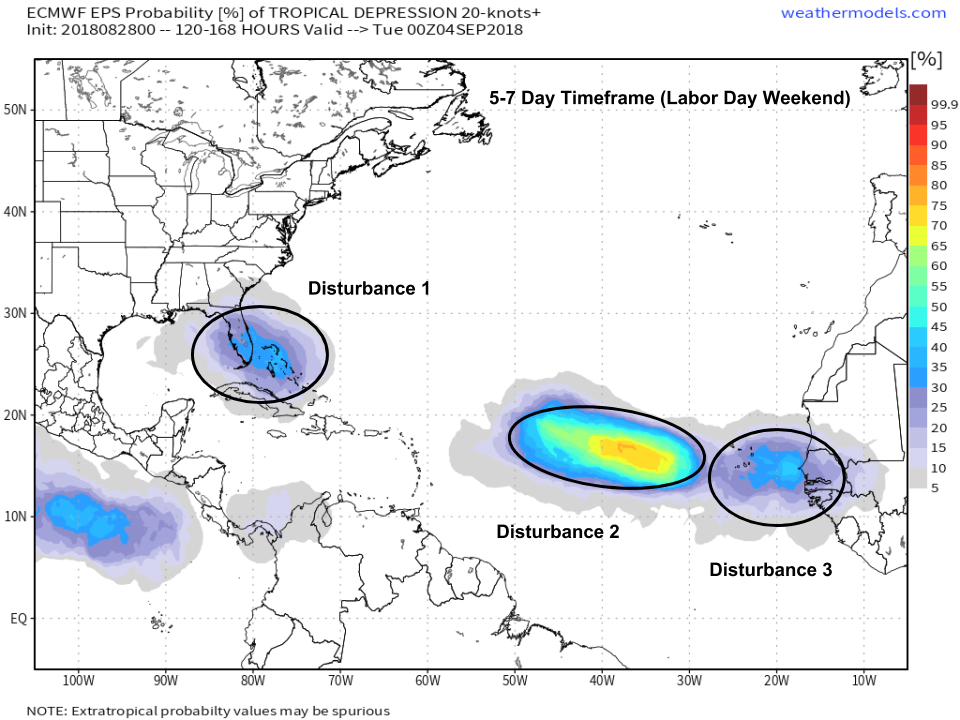 If you’re looking for a clearer picture of where tropical activity may be in the forecast, try the EPS’s tropical cyclone probability products. While sometimes the algorithm here can be funky, especially relating to higher intensity systems, it does a good job picking the signal from the noise in terms of which areas to keep an eye on. For Labor Day weekend, there are three. Two are in the deep tropics, and won’t pose a threat to the US for quite a while (if ever). One of them though is forecast to move near/over Florida, and potentially into the Gulf of Mexico after that. While there are many details to be ironed out between now and then, and it is way too early to make any predictions about potential intensity/landfall etc., that’s the system most worth watching as we move into the first week of September.
I’ll have more details on that disturbance as its future becomes a little clearer. Until then, keep tabs on it with the tools we have at weather.us and weathermodels.com, and be sure to be wary of any operational model run that looks overly menacing.
-Jack




Thanks for the post Jack. Loved the insight. Look forward to more!