Torrential Downpours In The Northeast Today While Irma Churns Closer
Hello everyone!
Today’s US weather is once again going to be dominated by a cold front moving through the northeast. The cold front today won’t have quite enough energy to produce a widespread severe weather threat, but it will have more than enough moisture to drive some torrential downpours.
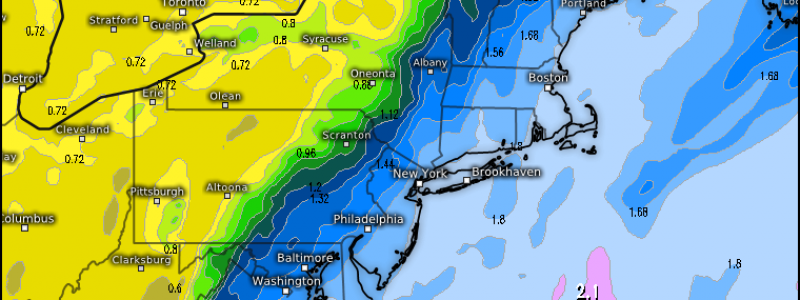
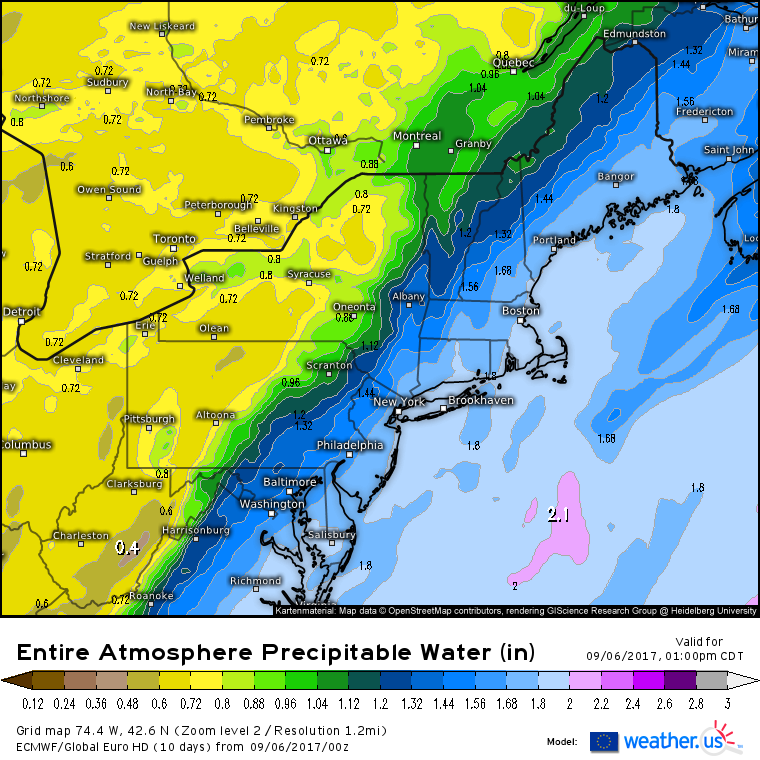
This is a map from the ECMWF model showing the amount of moisture in the air this afternoon. Generally values here above 1″ are supportive of heavy rains with values above 1.5″ indicating very high moisture content. As you can see, the coastal plain from Eastern Maine all the way down through the Mid Atlantic has more than enough moisture present to support heavy rain.
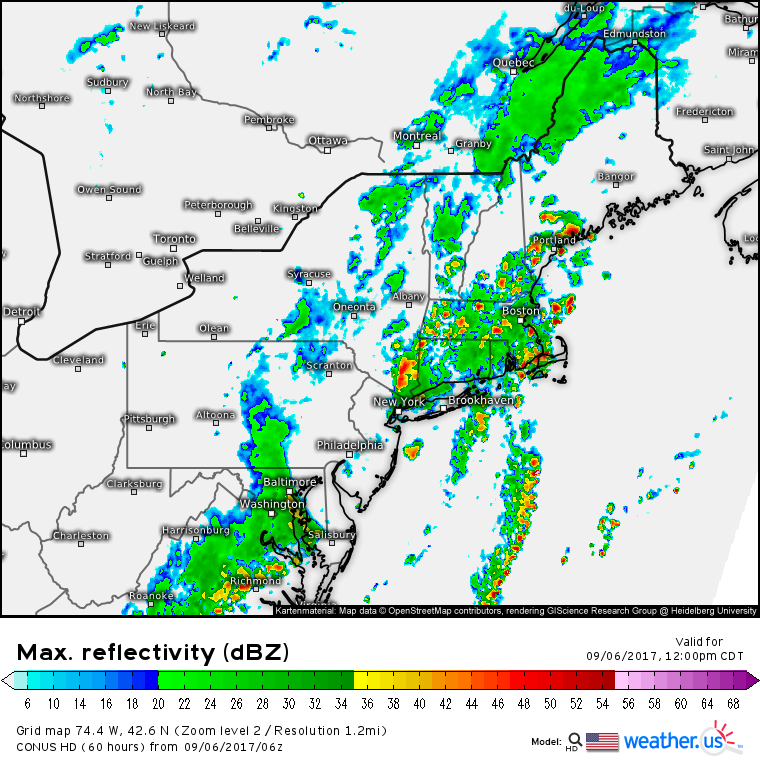
Today’s heavy rains will come in two rounds as two weak waves of low pressure travel northeast along the front. The first round will be in the early afternoon across parts of SE NY, Southern New England, and coastal ME/NH. The second round will follow later tonight and into tomorrow morning.
Farther south along the front, some strong to severe storms can’t be ruled out across parts of the coastal Southeast.
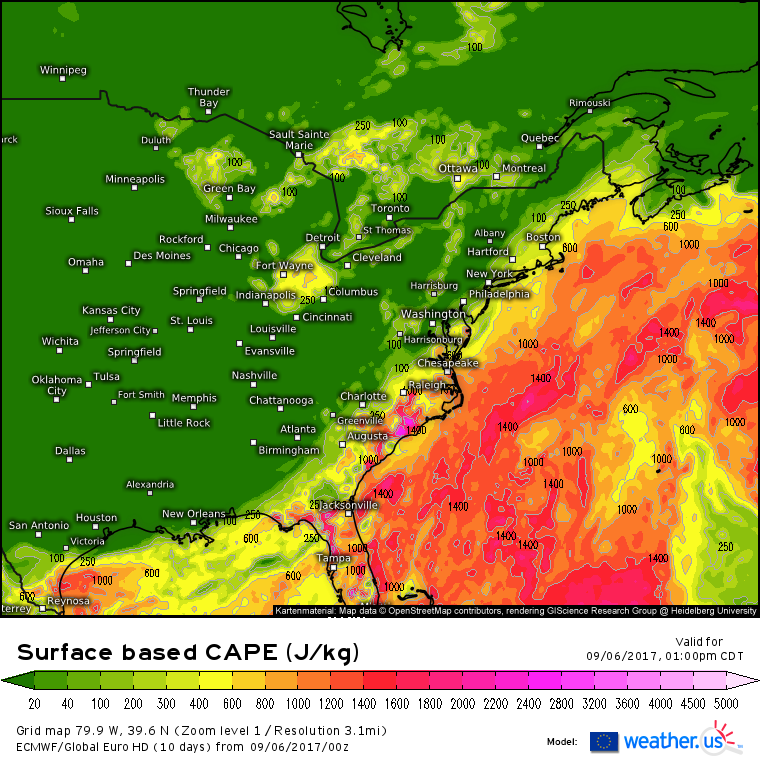
This map shows the amount of energy available in the atmosphere for thunderstorms. Notice how there’s very little if any energy over the Northeast and Mid Atlantic, but plenty in the NC/SC/GA area. This is why those regions will see this front bring some severe thunderstorm activity, but areas farther north will not. The main threat with these storms will be gusty winds and small hail, though a tornado cannot be ruled out.
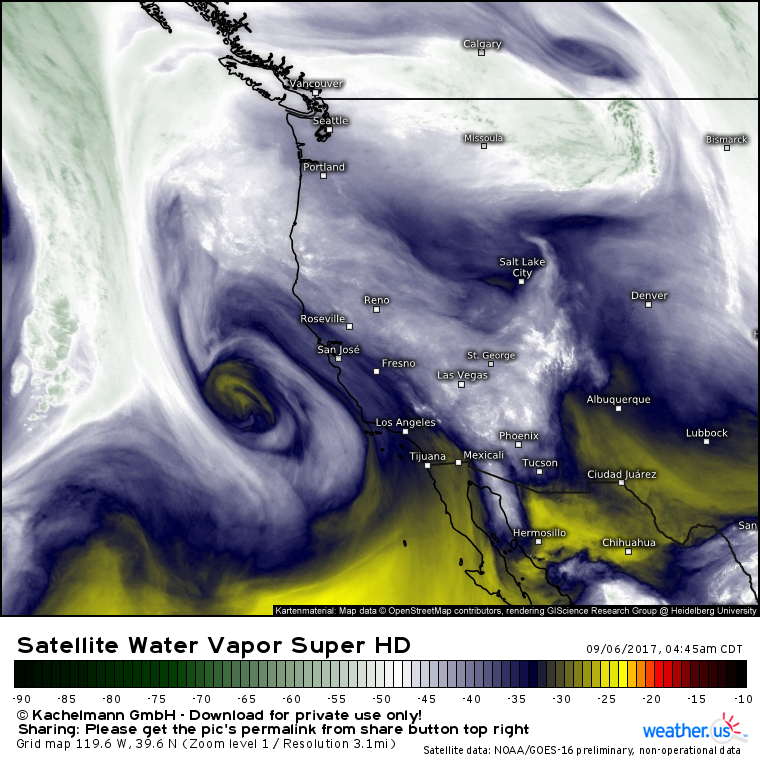
Farther to the west, an upper level low moving into California will help fuel some strong thunderstorms in the northeast part of the state. 
Some of these storms could be severe with gusty winds and small hail.
What about Irma?
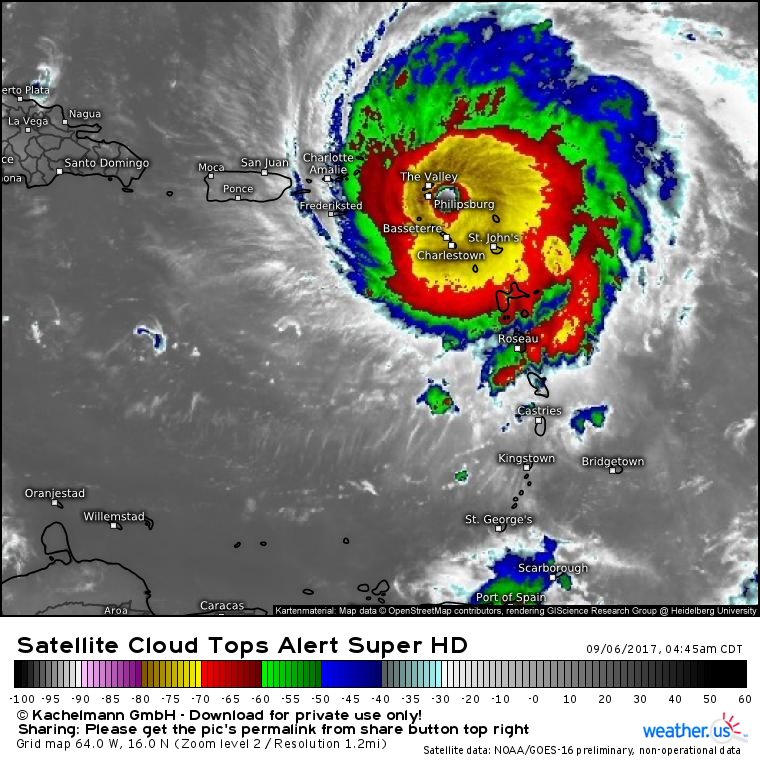
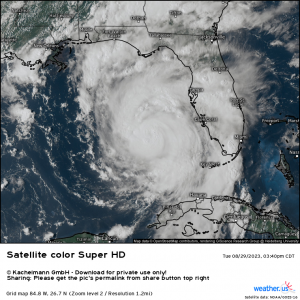
Irma strengthened yesterday evening to a Category 5 storm with 185 mph winds. That intensity continues today as the storm moves through the Leeward Islands. The environment around the system continues to support Irma maintaining this intensity as it moves west-northwest in the coming days.
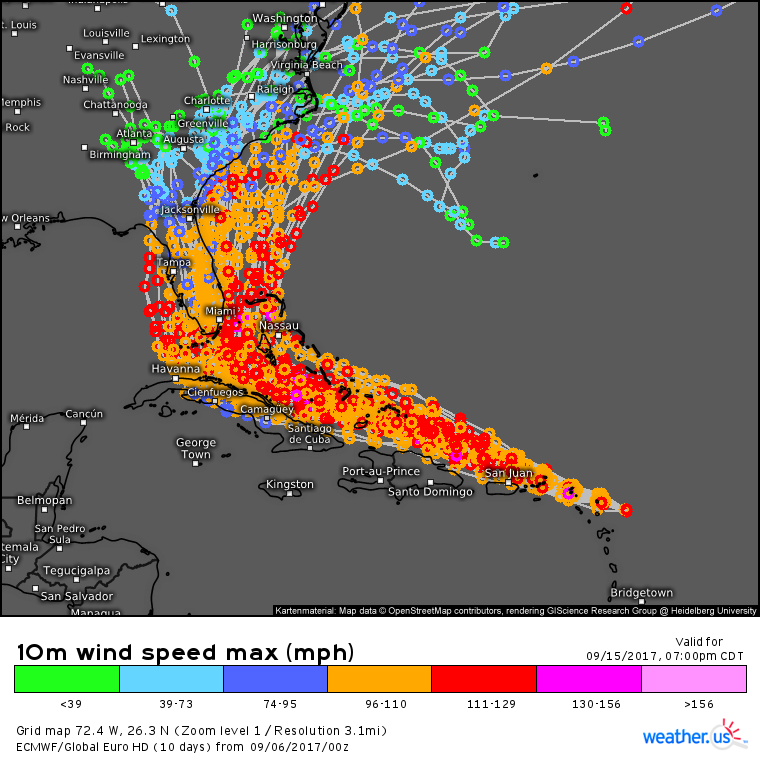
What’s next for Irma? The same basic forecast I presented on Monday evening still applies. Irma will move WNW just north of Puerto Rico and Hispaniola before turning more to the west in the direction of Cuba. After making a close brush with the Cuban coast, the system will turn north. There’s still some uncertainty as to where that turn north will happen. As a result, there’s still some uncertainty with regards to the impacts Southern Florida will feel from the storm. However, even if Irma makes the turn north a little bit sooner than forecast and ends up tracking closer to Nassau than Miami, residents of Southern Florida should still be preparing for at least tropical storm conditions and impacts. I’ll have much more information tomorrow afternoon regarding Irma’s next steps.
Outside of the cold front discussed above as well as those storms in California, generally quiet weather is expected across the US as Irma is still a few days away. For more information on your local forecast, head on over to weather.us.
For more information on the local forecast for Maine and New Hampshire, check out my local blog post from this morning.
Jack Sillin is a weather nerd and forecaster who regularly writes for weather.us and 33andrain.com.



Forecasterjack said to ask him if we had any questions about Weather.us (Great site by the way!)…
I do, but would also appreciate anyone’s knowledgable reply:
1.The wind speed parameter when displaying either US, or Euro models. Is this displaying wind speed at ground level(or close to ground level)?
2.Does the parameter “Gusts,3hr (mph)” translate to a gust of wind lasting for 3hrS?
3.How does the parameter “Wind – Mean spead” compare to NHC’s 1 minute Average wind speed?
4.Also there seems to be a great difference between how the US and Eur wind speed when comparing the difference between Mean Speed and Gusts particular geographic area as the eye crosses…
5.The US (GFS) model seems to have very little difference on the east side of the wall between mean speed and gusts( toggling between the two parameters)…..
The Euro displays much higher gust speed on the east wall as it rides the coast, but much lower mean speed.The mean speed seems to decline very rapidly just a few mile from the coastline.
Is this due to the HD resolution on the Euro vs SD GFS?
6. Which model, and parameter would be recommended for accuracy in determining the average & gust speed at ground level, comparable to NHC 1 minute average?
7. Also, what is the Wind Power – speed 330 ft only avail on Euro? not familiar with term Wind Power vs Wind speed.
Thanks in advance.
Hi Spacecoast,
We’re glad you’re enjoying the site!
1. The wind speed parameter is for the standard 10m height.
2. The 3hr wind gust parameter is for the max gust over a period of 3 hours. It’s meant to give you a reasonable upper estimate on the max wind speed you could see over a given 3 hour period.
3. Our average wind speed is measured over the standard 10 minute interval, as opposed to the NHC’s 1 minute interval, but the premise is the same: If you average out all the gusts and lulls over some time period (for us, 10 minutes, for NHC, 1 minute), you’ll get the average wind speed.
4. Indeed, the GFS (US) and ECMWF (Euro) models are quite different, both in their resolution and in their physics. This results in much different simulations for each model, including wind speed, wind gusts, and every other parameter. Generally speaking, the ECMWF is much more accurate, though it’s by no means correct every time.
5. Yes, the resolution does play a part in this. The ECMWF assumes that extremely fast wind speeds (140mph+) just above the surface in the eyewall could be “mixed” down to the surface for a brief moment, even inland. However, the ECMWF also realizes that when wind encounters obstacles on land (trees, buildings, hills, cars, etc) there is increased friction, and thus the winds slow down a little bit. The GFS realizes this too, but it underestimates just how much of an effect this friction has. As a result, the ECMWF sees that most of the winds will be slowed down by friction (lower mean wind speed) but a few really high gusts could sneak in briefly. The GFS doesn’t see this as well.
6. We don’t have the exact parameter you’re looking for, but we can get really close. Wind in general is measured at 10m because it’s the happy medium between too much friction at the ground level, and too little friction to be realistically useful for measuring near-surface conditions. So while we don’t have “ground level” winds, we do have 10m wind data which should get you within a few mph of the conditions you would experience while standing outside and extending ~2m into the atmosphere. To get wind gust information, please use our 3 hourly wind gust parameter. To get the most accurate model, use the ECMWF which is statistically proven to be far superior to the GFS.
7. The Wind Power parameter is merely the average wind speed at 330ft. It is a parameter we designed so that wind power companies with wind turbines could get a sense of how fast the wind was blowing at the elevation of their turbines which extend farther up into the atmosphere than 10m. The farther up those wind turbines go, the less friction there is, and thus the greater the wind speed. Because the wind is faster at 330ft than 30ft (10m), but slower than some of our upper air maps (925mb =~2500ft), we needed to create a new parameter to meet their needs.
I hope this helped, please spread the word about our site and let me know if you have any other questions!
-Jack Sillin (forecasterjack)