Quiet In The Tropical Atlantic Heading Into July
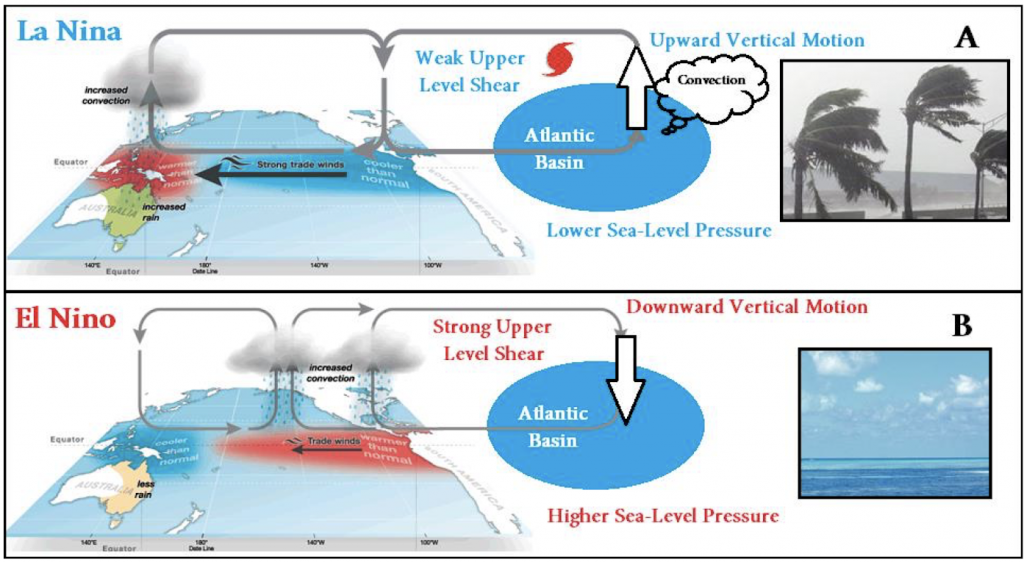
Here’s a simplistic graphic that explains why we tend to deal with average to above average seasons during La Nina’s, and more toward below average seasons during El Nino’s where conditions become generally less conducive for tropical cyclogenesis in the Atlantic. We usually see an active Eastern Pacific hurricane season during El Nino’s as well, since this is where the bulk of rising motion happens while in the Atlantic we see increased vertical shear and more dry air from Africa. This graphic below is for reference going forward in this blog and why it’s relevant going forward.
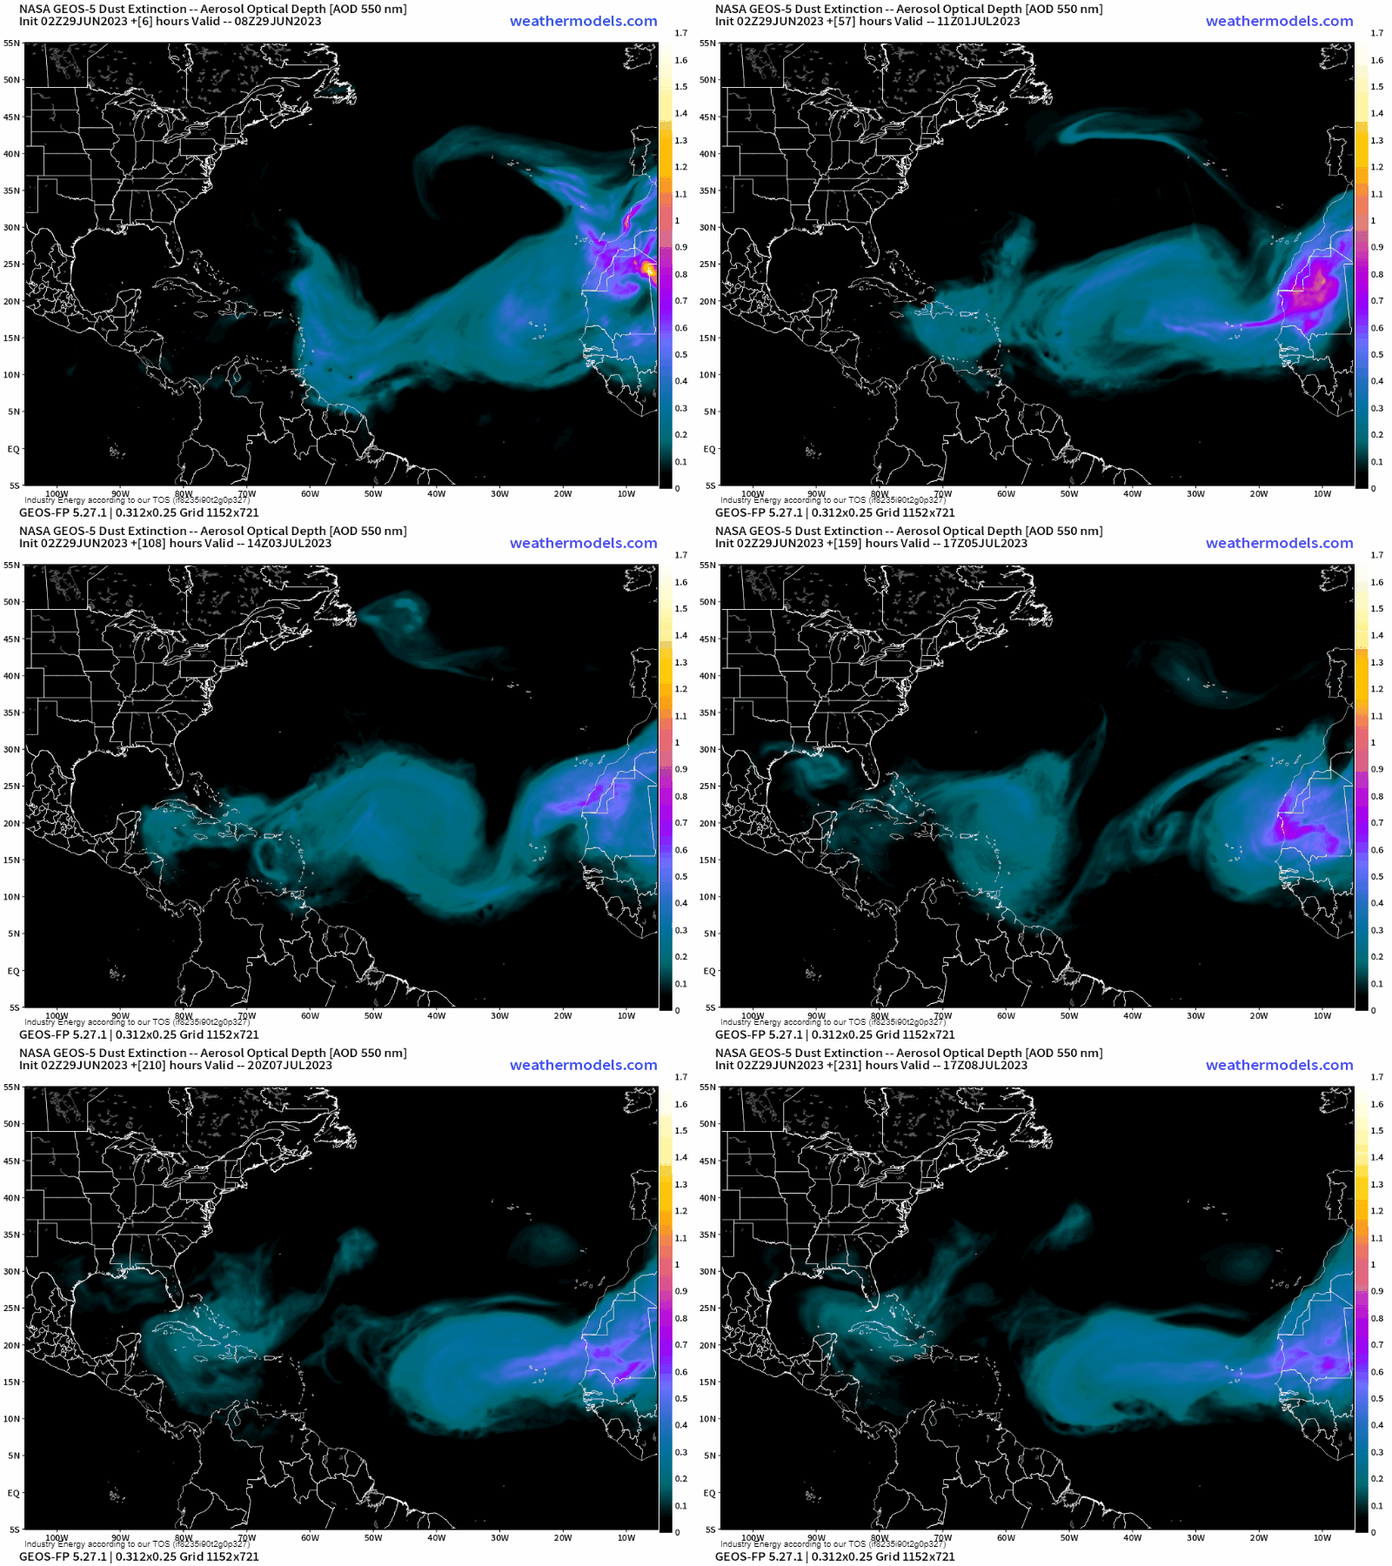
Currently, we have a few factors that are non-conducive for tropical cyclone formation across the Atlantic basin. First, there will be several plumes of Saharan dust that’ll emanate from Africa. This dusty, dry air plays a large role in inhibiting vertical motion from thunderstorms, along with a few other main reasons in general that stymie tropical cyclones in general. This animation verbatim of the NASA GEOS-5 model takes us to the middle of July below, and we see there’s no real shortage of this dust.
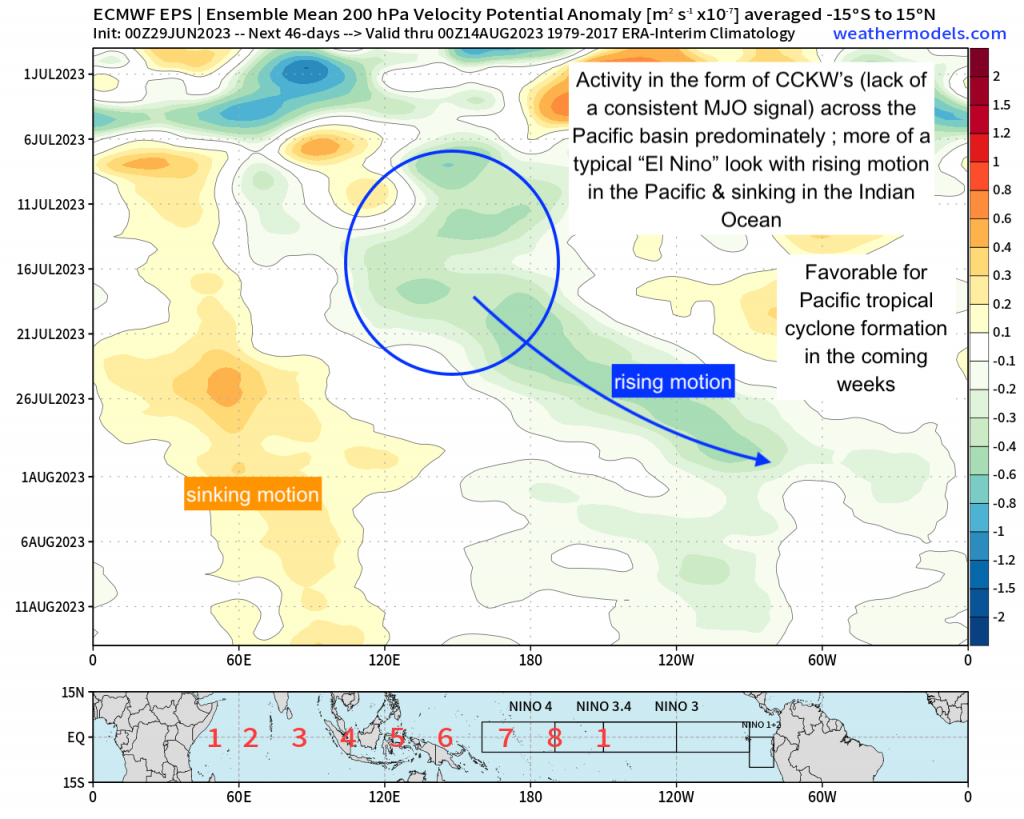
Second, from a sub-seasonal forecasting perspective, (i.e. utilizing the MJO circulation and where it may be at a moment in time along the Equator that has large implications on the jet stream across the globe), lets dive into a hovmoller where we can see the general forecasted areas of rising and sinking motion via the EPS. Again, just as a refresher reading this graphic: vertical axis is time and bottom axis is longitude, so we’re seeing where areas of divergence (blue/green) and convergence (orange/yellow) occur at a certain point in time in the near to long-term.
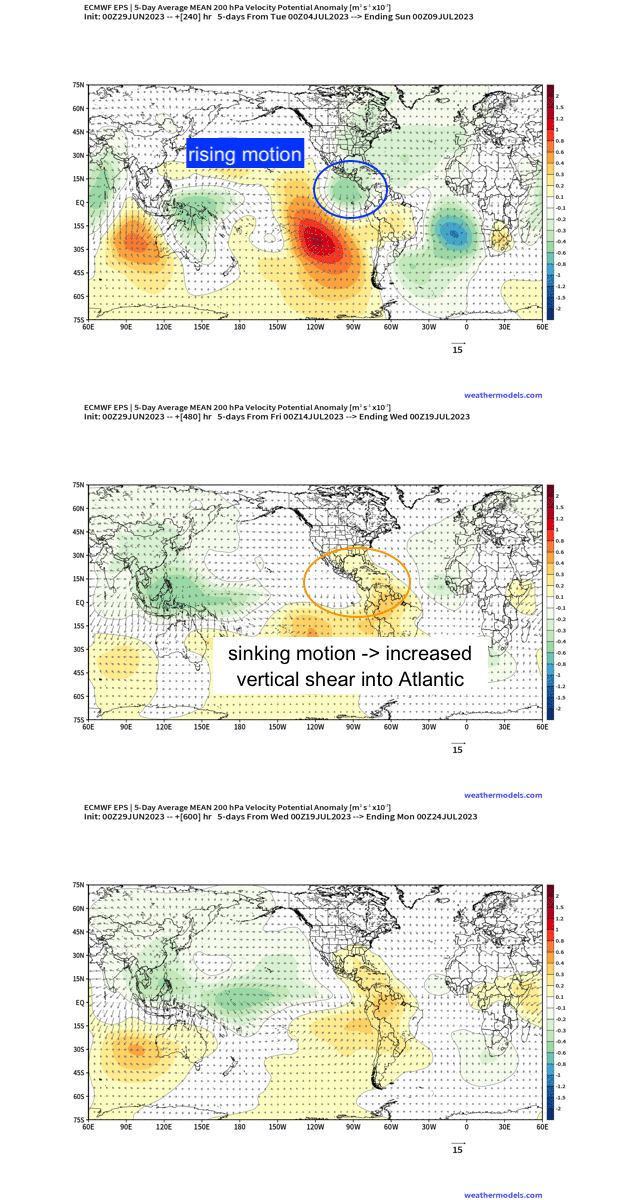
Verbatim, we see that the bulk of the rising motion – embedded within are “CCKW’s” (convectively coupled kelvin waves) that are like “mini MJO’s” as they’re propagating tropical disturbances along the Equator that can incite rising/sinking motion – occurs across the majority of the Pacific basin. This takes us out toward the latter half of July, where by that range uncertainty plays a bigger role and we know changes arise; however, notice here that the divergence seems to stand “still” between the prime meridian – 80*W. In conjunction, convergence (sinking air) is shown primarily in the Indian Ocean. If you look now at the first image I put together, doesn’t this look quite familiar? Above, we have rising motion in the Pacific, and sinking air across the Indian Ocean / Maritime Continent. Compare again that graphic to the hovmoller, and we see a classic El Nino circulation (or Walker Cell circulation to be more technical). This is the reason why we’re going to see unfavorable conditions for hurricane development across the Atlantic due to increased vertical wind shear from such the rising motion in the Pacific and increased shear from tropical cyclones that will develop in the Eastern Pacific. Along with this, we’ll see increased stability across the Main Development Region and a continuation of Saharan Dust with an increase in trade winds in the Atlantic (causes cooling and augments stability). The GIF image below helps to show such areas of rising and sinking motion, and to visually “see” why we see a lack of any forecasted cyclones via HIRES ECMWF and the EPS.
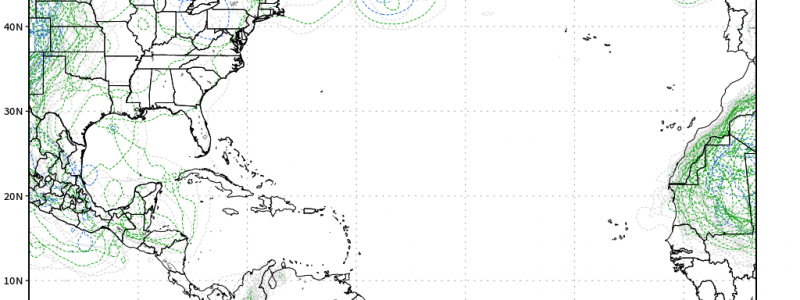
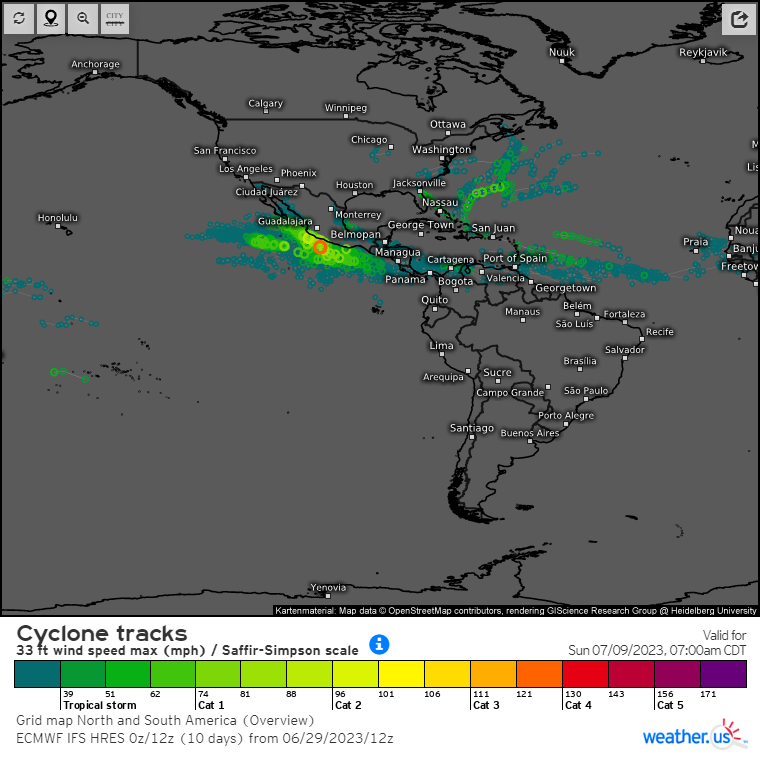
Notice the stark contrast between the East Pacific forecasted cyclone spaghetti tracks, and the scare Atlantic heading into early July via HIRES ECMWF.
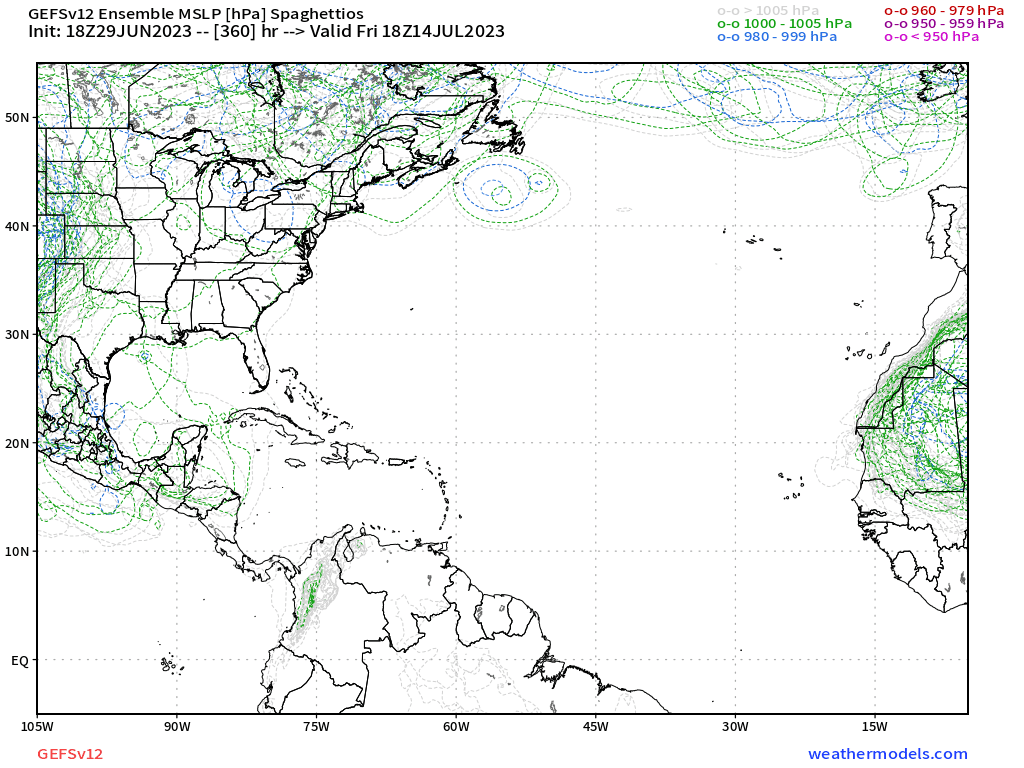
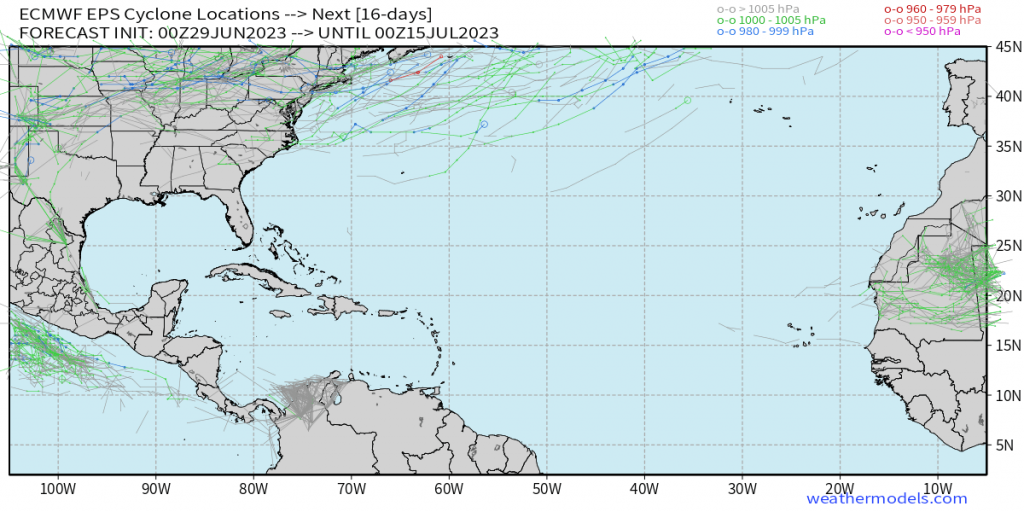
Even the GEFS spaghettio’s plot has absolutely next to nothing out to the middle of the month. Compare that to the EPS tracks, and we see the empty Atlantic basin.
I should also mention that during El Nino’s from a climatological standpoint, we don’t typically see the activity (even if it’s a below average season) transpire until the latter half of August into September and October. From a long range forecasting perspective, however, this is how we can garner higher confidence in whether we’ll see a “perk up” in tropical activity by analyzing the sub-seasonal tropical signals that I’ve discussed a few times, especially last summer. Hopefully this helps to give you an insight into how large-scale circulations and patterns become either conducive or unfavorable for certain types of weather phenomenon; in this case, tropical cyclones!
