Pacific Storm To Bring Heavy Rain And Snow From Coast To Coast This Week
Hello everyone!
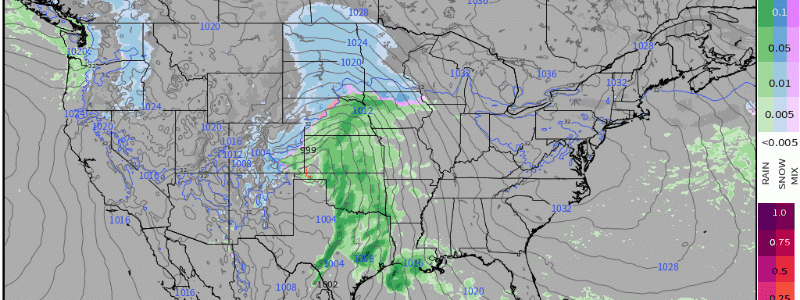
A strong Pacific storm is moving ashore in California this afternoon with heavy rain and mountain snow already impacting parts of the state. The low will move east tomorrow, bringing precipitation to parts of the southern Rockies before emerging onto the Plains for Wednesday. As the system redevelops in the Plains, it will bring heavy rain, severe storms, gusty winds, and plenty of snow. The system will then move east for Thursday and Friday with rain expected for much of the East outside of the mountains of New England where cold air will linger long enough for a mix of snow, sleet, and freezing rain to fall. I’ll outline each part of the system briefly here, explaining some of the dynamics at play and showing how to use the tools we have at weather.us and weathermodels.com to visualize the various aspects of the storm.
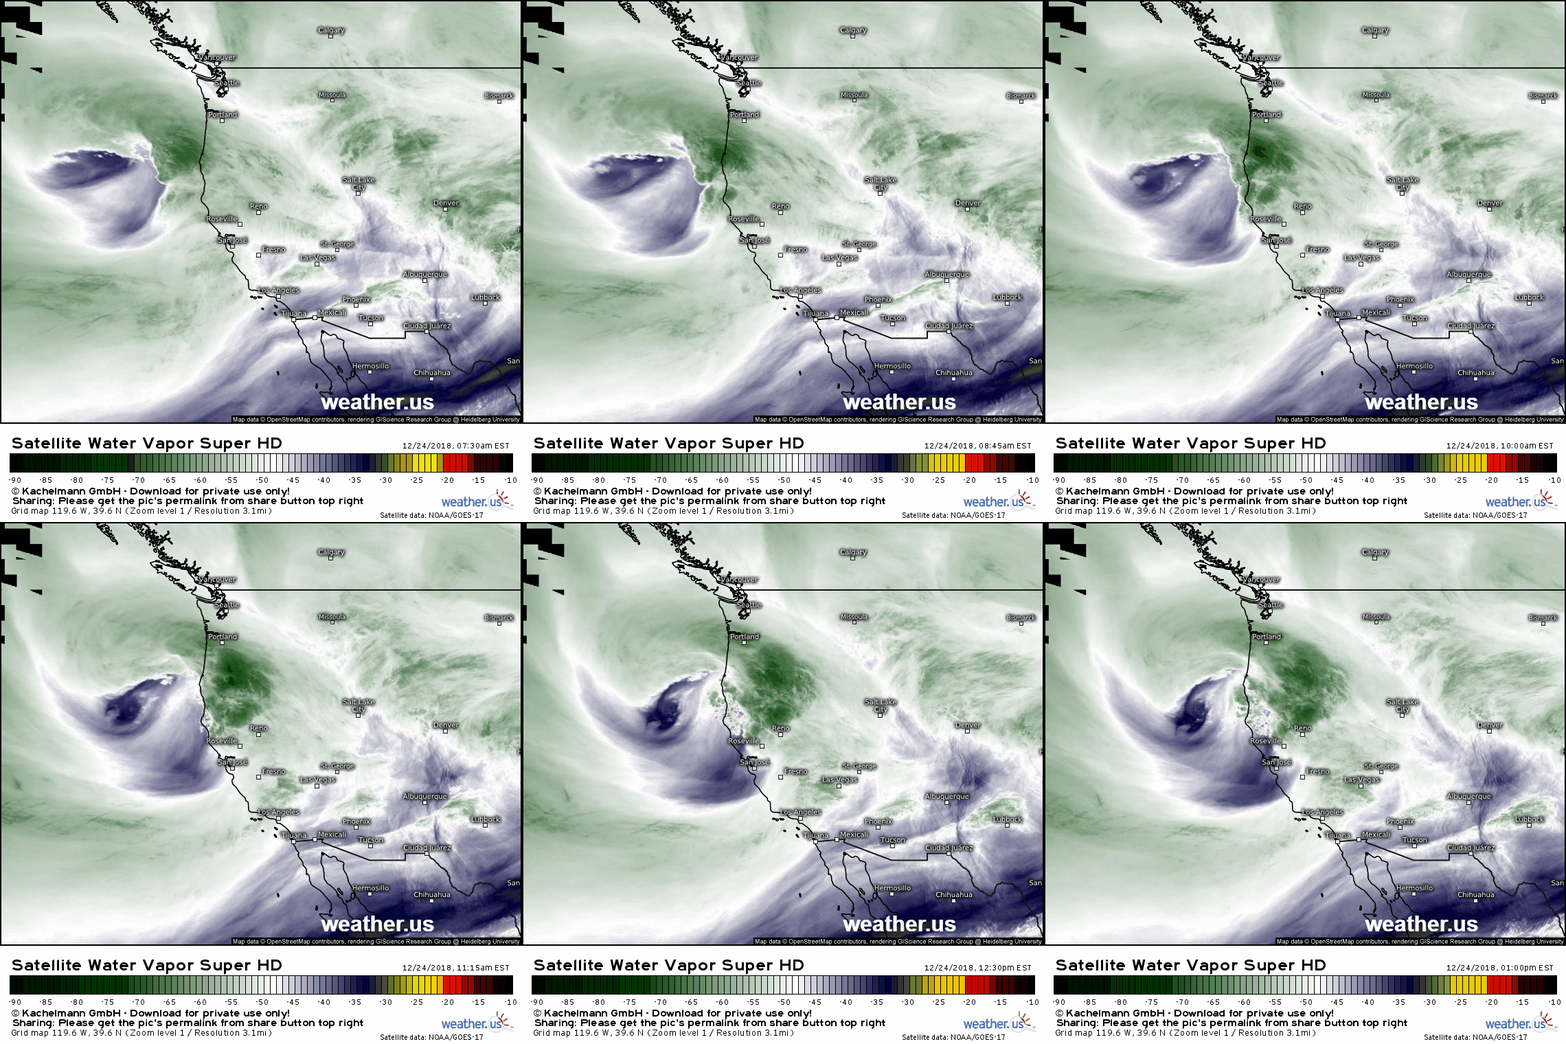
Here’s a look at the system this afternoon via GOES-East water vapor satellite imagery (tutorial video). The strength of the system is shown by the development of convection (speckled green pattern) near the Northern California coast, as well as the drying (increasingly dark blue colors) SW of San Jose. The drying indicates robust sinking air, as air that sinks becomes warmer, and thus drier. Because mass is conserved, if air sinks in one place, it must rise in another. That rising also must be equally as strong, and in this case the robust lifting is located to the NE of the storm, over N CA. Of course the rapid swirling of the air around the low’s center is another indication that this is a fairly strong system. You can tell a lot about the atmosphere just from WV imagery!
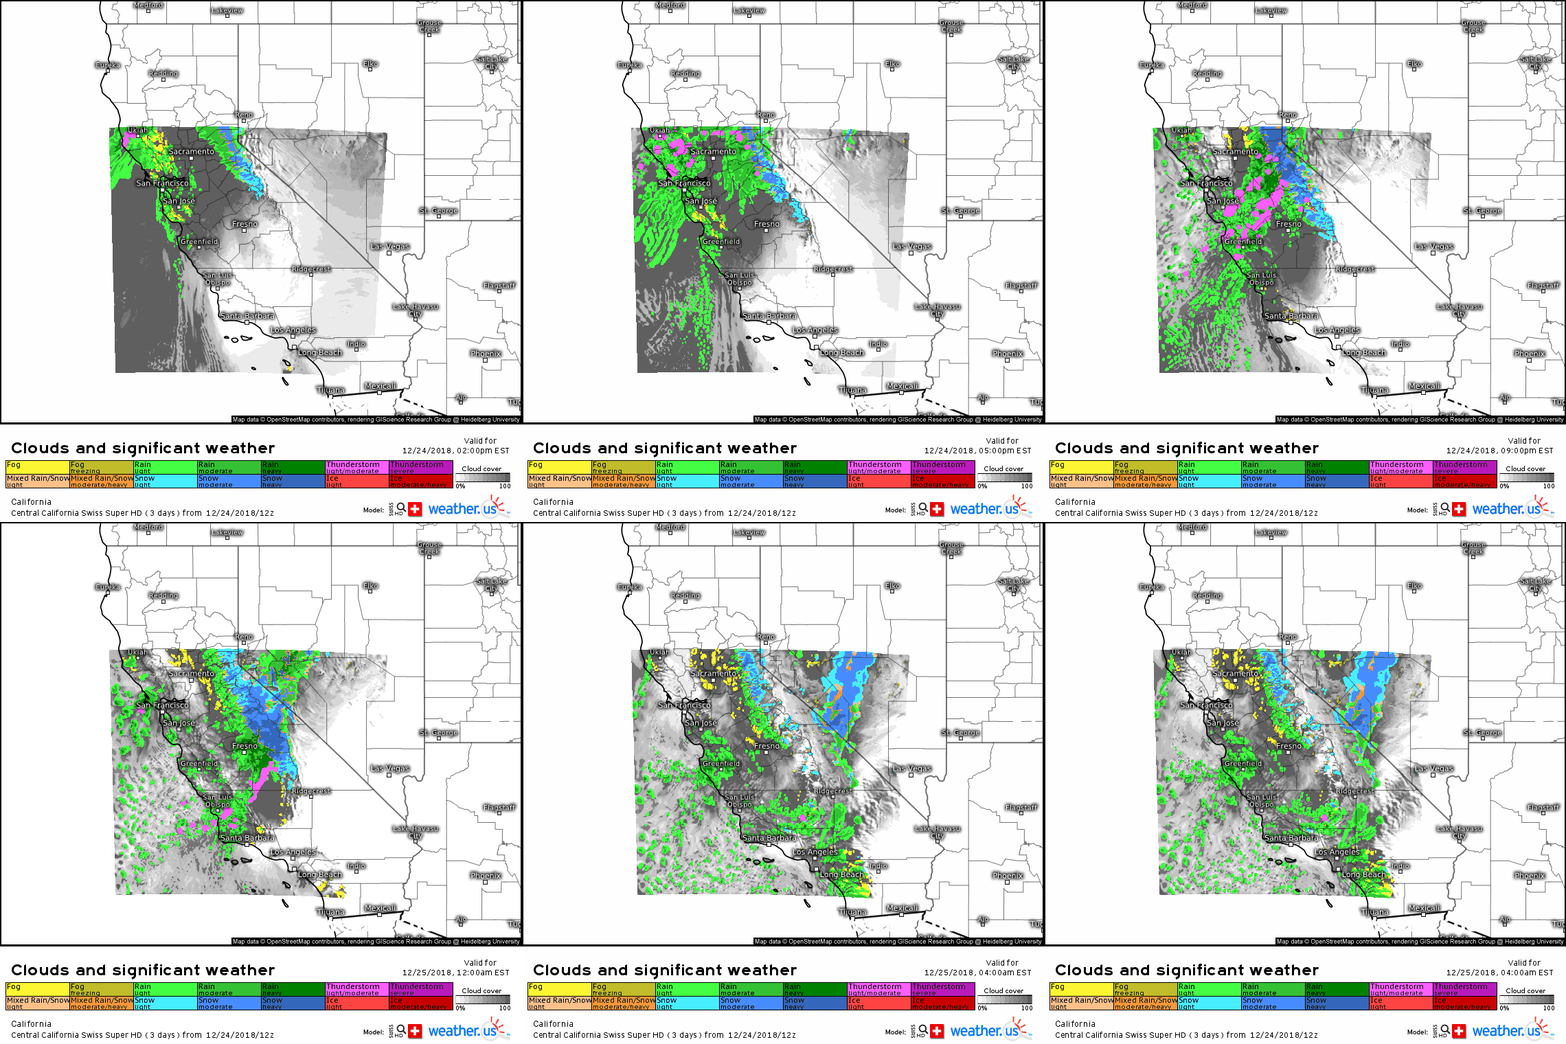
The storm will shift SE through CA tonight and tomorrow, with heavy rain and mountain snow expected. The Swiss Super HD model for Central CA highlights this process well. Its other output is also super useful for picking up on terrain-sensitive rain/snow line shifts, as well as other small scale phenomena such as thunderstorms.
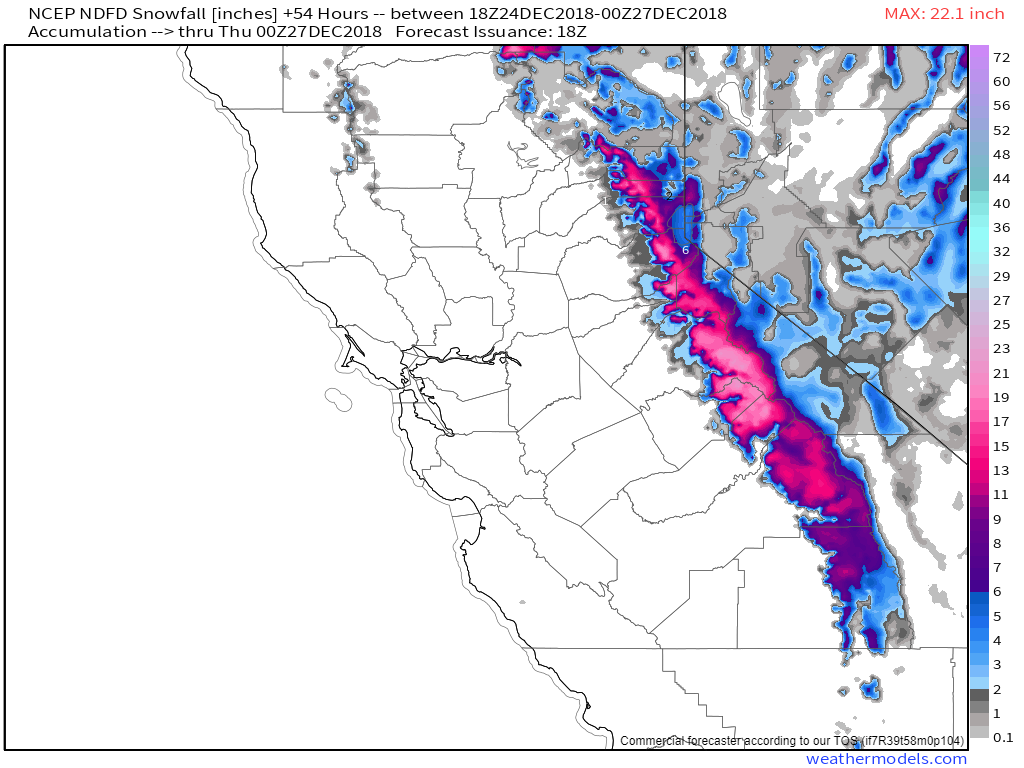
Snow in the Sierras will pile up on the order of 1-2 feet over the next couple days. The highest totals will be south of the Tahoe area, but all the peaks should get in on some decent totals. The mountain snow is good for those who ski and those who depend on the snowpack for water in the dry season. Snow will wrap up on Tuesday afternoon as the storm moves into Arizona and New Mexico. Map via weathermodels.com.
As the system emerges onto the Plains on Wednesday, here’s what the upper level jet will look like. The storm itself is visible in the form of an upper level trough/low stretching through the Rockies with an area of broad divergence located to the east. A strong jet streak is noted across the Great Lakes, and the right entrance region of that jet will help enhance the divergence a bit across parts of the Upper Midwest/Northern Plains. The result will be gradual lifting that leads to a reorganization of the surface system. As the surface system gets going again, we’ll be watching for the development of heavy rain and severe storms SE of the low’s track, along with heavy snow and gusty winds NW of the low’s track. Map via weathermodels.com.
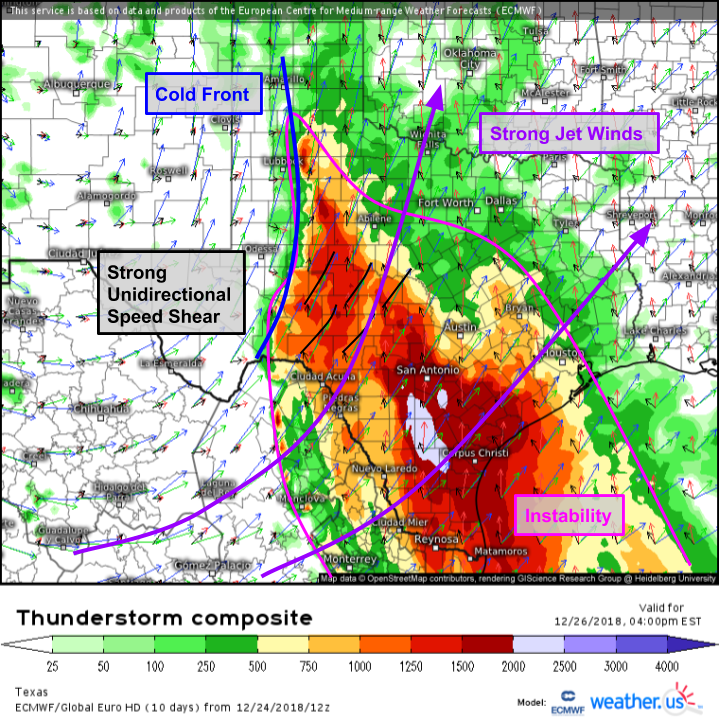
The storms will arrive first on Wednesday afternoon. The ECMWF’s thunderstorm composite map (tutorial video) shows strong instability as a result of warm moist air flowing NW from the Gulf of Mexico. Strong jet stream winds discussed above will be present in the upper levels, and as the surface storm gets going again, a cold front will sharpen up to its south. These features will combine to produce a severe weather threat across parts of Central Texas on Wednesday afternoon/evening. Shear profiles are of the unidirectional nature, with the lines connecting the wind vectors at different heights more or less straight. This indicates little change in wind direction with height, but a solid change in wind speed with height. As a result, storms will likely be of the more linear nature with damaging winds the preferred hazard. That said, a tornado can’t be ruled out especially farther east where surface winds are more southeasterly.
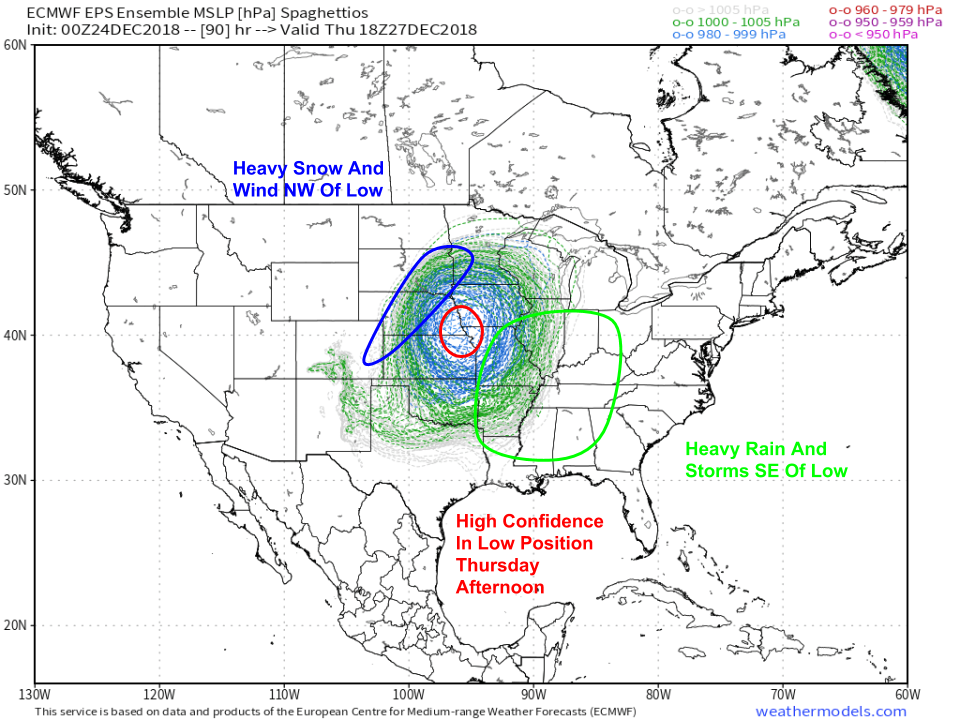
After developing in the TX/OK Panhandles, the storm will move NE on Thursday. Heavy snow bands will develop on the NW side of the low, and the pressure gradient between the system and strong high pressure to the north will support strong wind gusts. Watch for low visibility due to heavy falling/blowing snow in these areas. Southeast of the low, heavy rain will fall as tropical moisture flows out of the Gulf of Mexico, but dwindling instability will likely limit the severe threat, especially as you head farther north. The tight clustering of the ensemble “spaghettios” indicates high forecast confidence in the low’s strength and position for that time. Unfortunately, that high confidence drops off pretty quickly on Friday. Map via weathermodels.com.
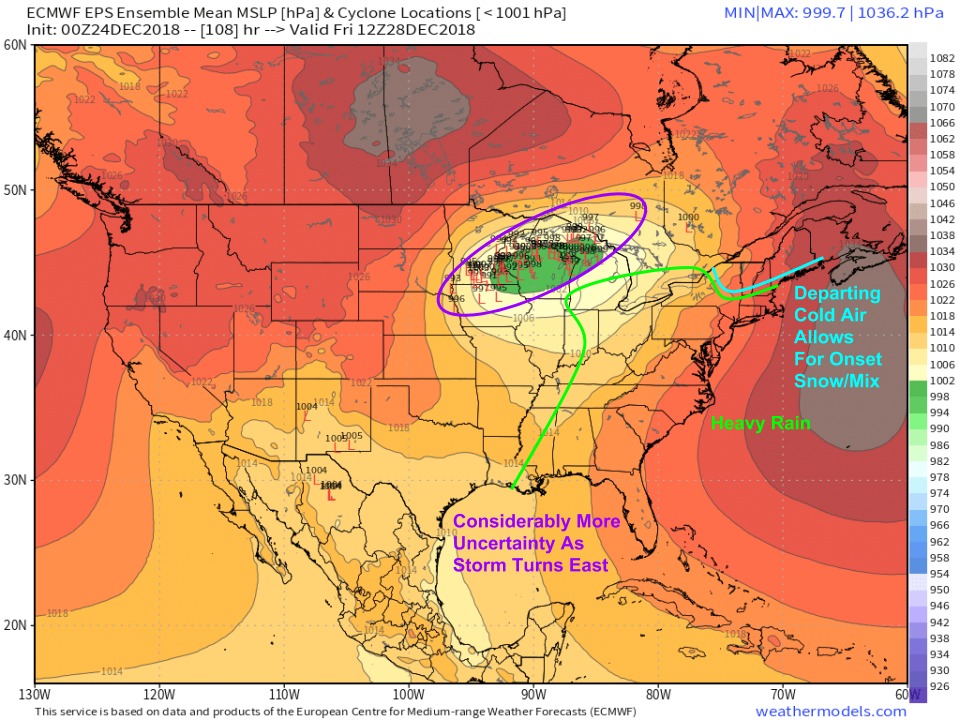
By Friday, ensemble members disagree considerably about the position of the low. This is because the low will be turning east in response to a new area of high pressure dropping south from Canada. Just how quickly that turn to the east occurs is a bit more uncertain. Possible outcomes in the position of the low range from SW MN all the way to the UP of Michigan. The same general pattern will apply, with snow to the NW of the low and heavy rain to the SE, but the exact demarcation line gets a bit fuzzier as you move into Wisconsin and Michigan. Along the East Coast, this will be a mainly rain event as the storm tracks well north of the big cities. Departing cold air will get hung up in the mountains of New England at least initially, resulting in an onset burst of snow there before a changeover to mixed precipitation. Most of the area will eventually see plain rain, but many of the sheltered valleys in NH and ME are notorious for holding onto the cold air much longer than it might initially appear. All precipitation will depart Saturday as the storm’s cold front moves offshore and ushers in a fresh Canadian airmass with cooler temps and drier weather. Map via weathermodels.com.
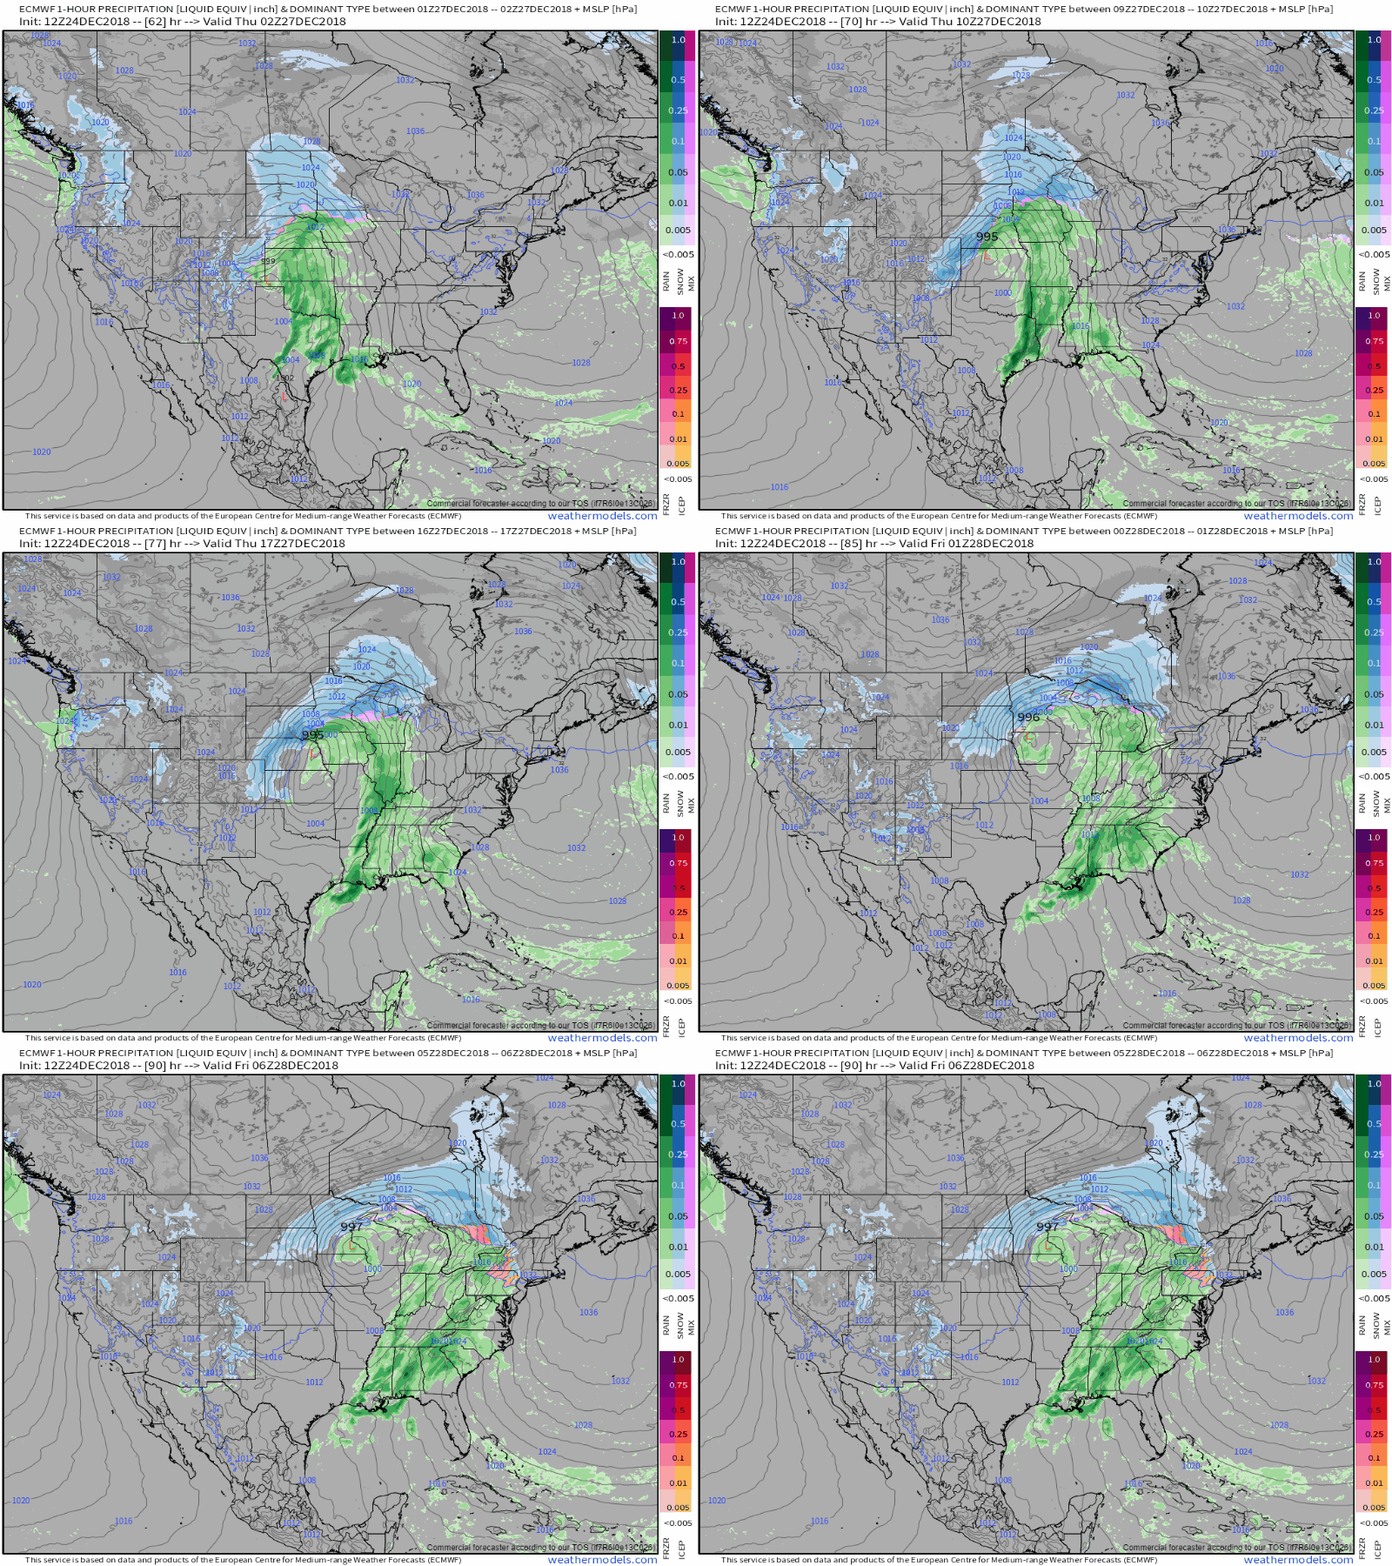
Here’s a general idea of what the ECMWF expects from this storm during the Wednesday night-Thursday night period. Note the storm signatures in the Mississippi River valley, and the heavy rain across the Midwest and Mid Atlantic. Bands of snow behind the storm could be quite heavy, especially as it’s intensifying over Kansas and Nebraska. This is just one deterministic run, so keep in mind it only shows one possible outcome for the onset snow/mix in WI, MI, and the Northeast. We’ll keep an eye on trends in those areas over the coming days as the eventual turn to the east becomes a bit more clear. GIF via weathermodels.com.
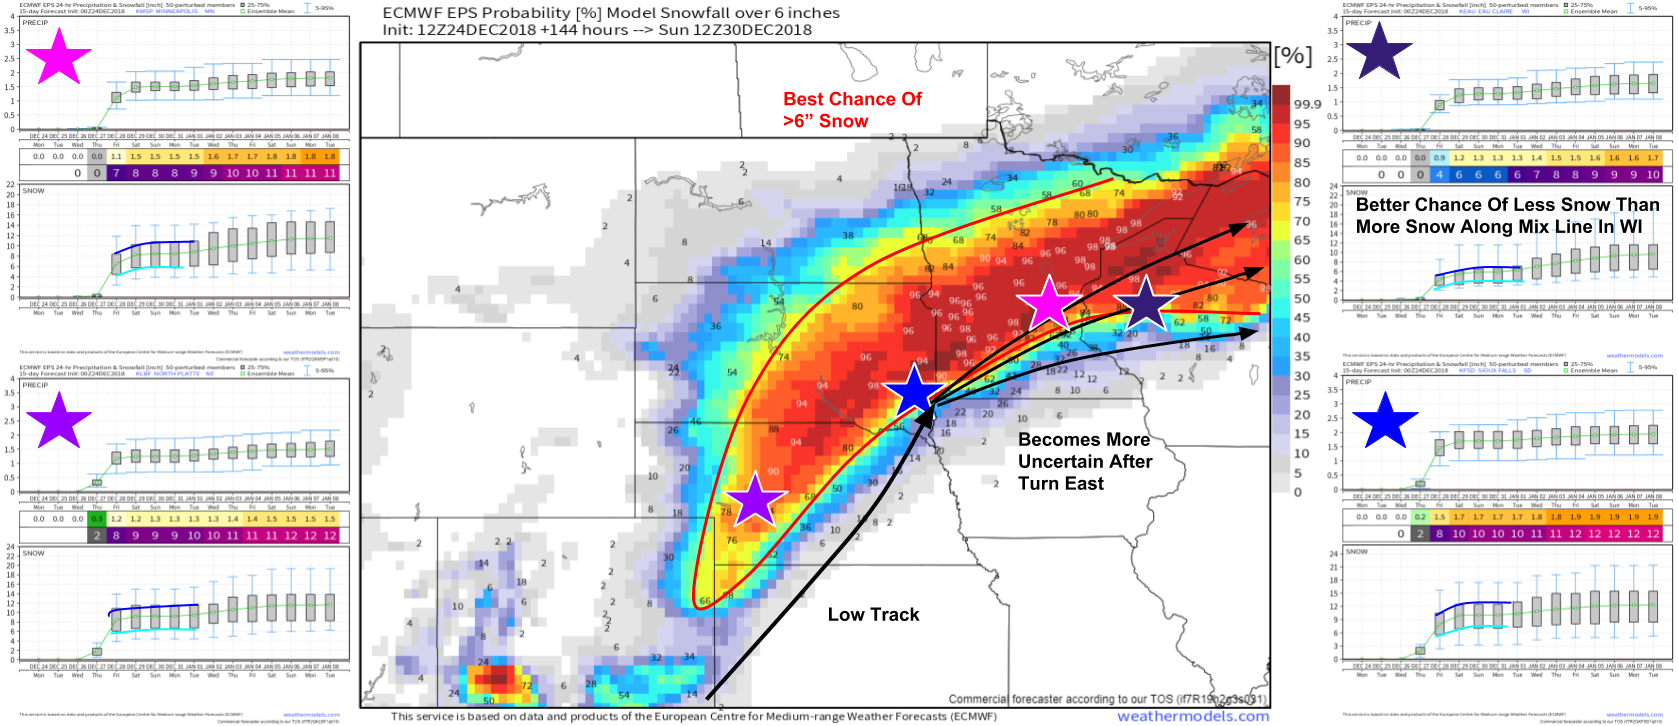
So how much snow is to be expected? Here’s a look at the first part of the system’s snow, from Colorado up through Minnesota and Wisconsin. The map is the chance that more than 6″ of snow falls, based on the ECMWF ensembles. The graphs are the EPS’ precip/snowfall forecasts for several selected cities, with their locations marked by the color coded stars on the map. For reference, I picked North Platte NE, Sioux Falls SD, Minneapolis MN, and Eau Claire WI. The forecast distributions for the cities near the center of the snow envelope are fairly uniform i.e. there’s an equal chance of more or less snow than the “mean” forecast. In the graphs, the mean is denoted by the green line. The value at the top of the grey box has a 25% chance of being exceeded, while the value at the bottom of the grey box has a 75% chance of being exceeded (thus the grey box represents the middle 50% of values).
Note that the distribution for Eau Claire is a little unusual compared to the rest. The top of the grey box lies quite close to the mean value. What does this tell us? Basically, there are a lot of ensemble members forecasting about 6″ of snow. However, some disagree (which is to be expected, there is a range of possible outcomes). Out of those that disagree, some naturally will forecast more snow and some less. If the same number of members forecasted more snow than less, the distance from the mean to the top of the grey box (75th percentile) and the bottom (25th percentile) would be the same, telling us that the chances of a >6″ snowfall were about equal to the chances of a <6″ snowfall. However, that is not the case here! The distance from the mean to the 25th percentile is much larger than the distance from the mean to the 75th percentile, meaning that more members lie below the mean than above the mean. It follows then that you should tentatively expect around 6″ of snow in Eau Claire, but if there was to be a forecast “bust” or surprise, it would be on the side of less snow rather than more. Map via weathermodels.com.
These city charts can be found with the “City Charts” tool at weathermodels.com. Don’t have a subscription or looking for more personalized data? Very similar charts can be found for any town in the world for free at weather.us with our Forecast Ensemble tool (tutorial video). Check it out for your town!
-Jack
