Major Winter Storm To Impact The East Coast This Weekend
Hello everyone!
A major storm system will impact the East Coast this weekend with heavy rain, snow, and a wintry mix in between. The storm will be forming along a very strong frontal boundary separating deep tropical moisture from bitterly cold Arctic air. The intense clash of airmasses will give this system plenty of energy, and the tropical connection will provide the fuel for heavy precipitation. As the Arctic air seeps underneath the incoming tropical surge, an area of mixed precipitation will develop along the boundary between rain and snow. This boundary will overlap with the I-95 corridor from Boston down to Philadelphia, with heavy rain along the immediate coast and heavy snow farther inland. Up in the mountains of the Northeast, snow totals could border on prolific with one to as much as three feet falling at ski resorts from New York to Maine.
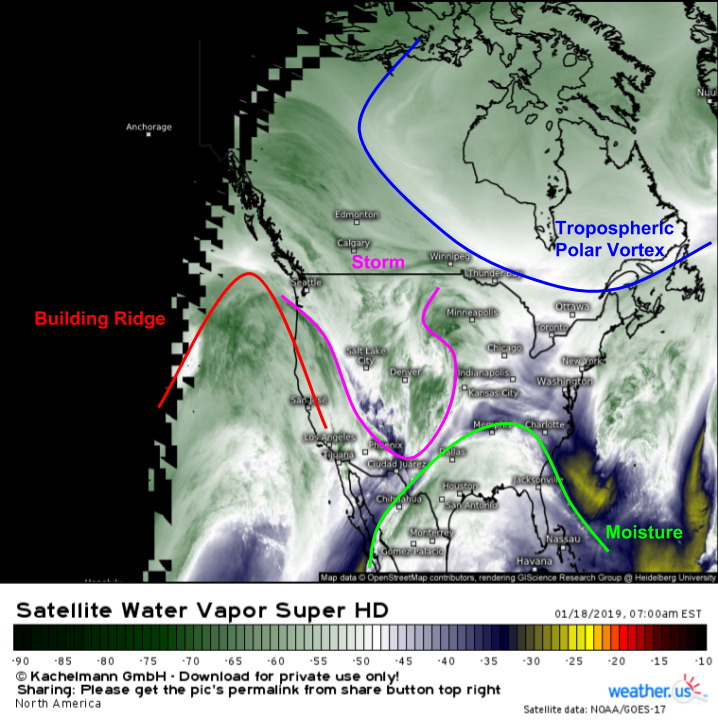
Water Vapor satellite imagery this morning is a great way to see all the elements important to the evolution of the upcoming storm. The upper level energy responsible for the actual low development is located over the Rockies, and will spill into the Plains later today. As it does so, it will begin to tap a deep reservoir of tropical moisture from the Eastern Pacific and Gulf of Mexico. Meanwhile to the north, the Tropospheric Polar Vortex has set up shop over NE Canada, providing an ample supply of cold air. The story of this storm is going to be the clash of airmasses, which will be particularly intense even for this time of year.
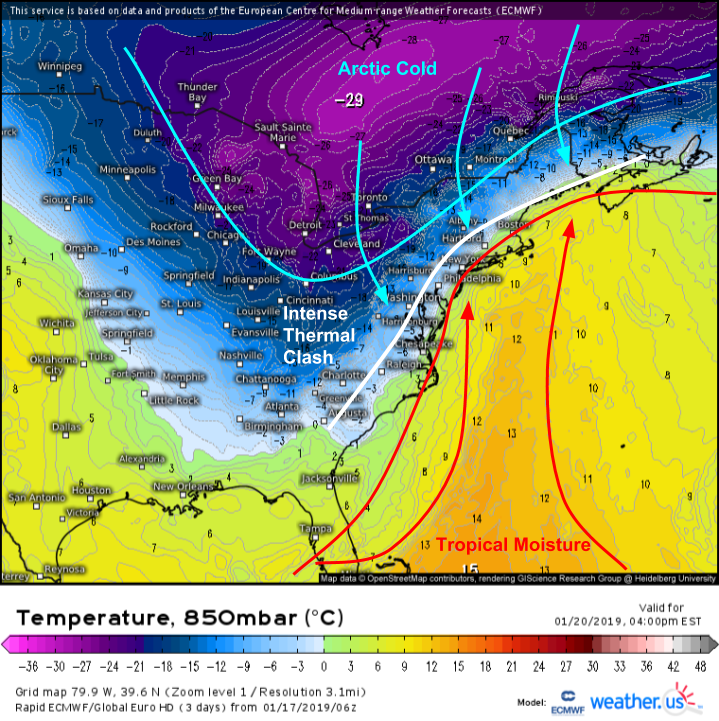
This 5,000 foot temperature map highlights the aforementioned airmass clash. Temps aloft just off NYC will be around 50 degrees, while the air above Buffalo will sit at around -10. This extreme temperature gradient will provide the basis for strong dynamic lifting, while the tropical moisture enables heavy precipitation and the Arctic cold lets much of that precipitation fall as snow away from the coast. Map via weather.us.
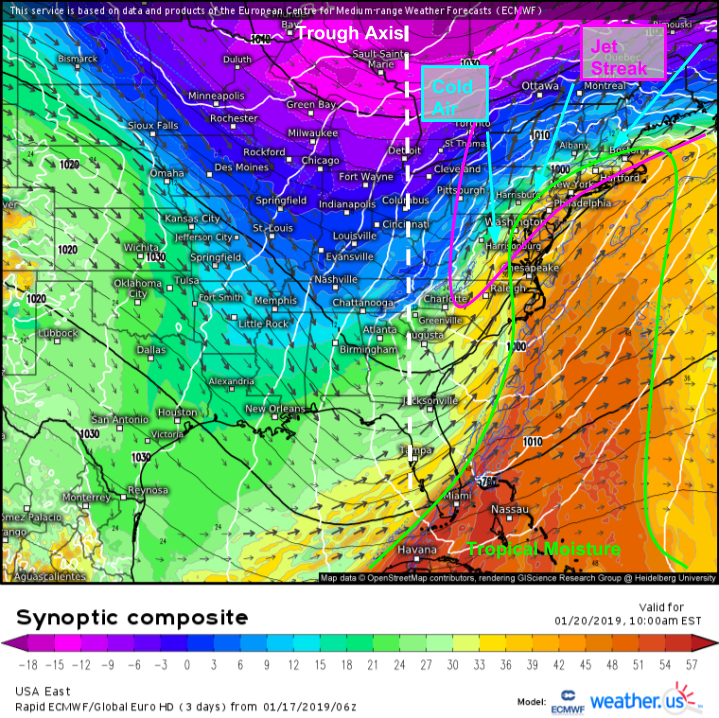
A more complete picture of the available dynamics is visible with the Synoptic Composite map. The shading is a measure of both heat and moisture. Red/orange shadings represent warm and humid air while blues and purples are colder and drier. Already we can see the thermal clash discussed above. However we can also see the surface pressure gradient by looking at the white isobars (lines of equal pressure). Note the tightly packed isobars across the Northeast as our storm system runs into an area of very strong Arctic high pressure. Additionally, we can look to the black lines and arrows for clues about the upper level setup. The black lines represent equal 500mb heights, while the arrows are vectors for 300mb winds. The strong trough axis is clearly visible in the height field just west of the surface storm, and a strong jet streak is also noted extending from the Mid Atlantic up into New England. Map via weather.us.
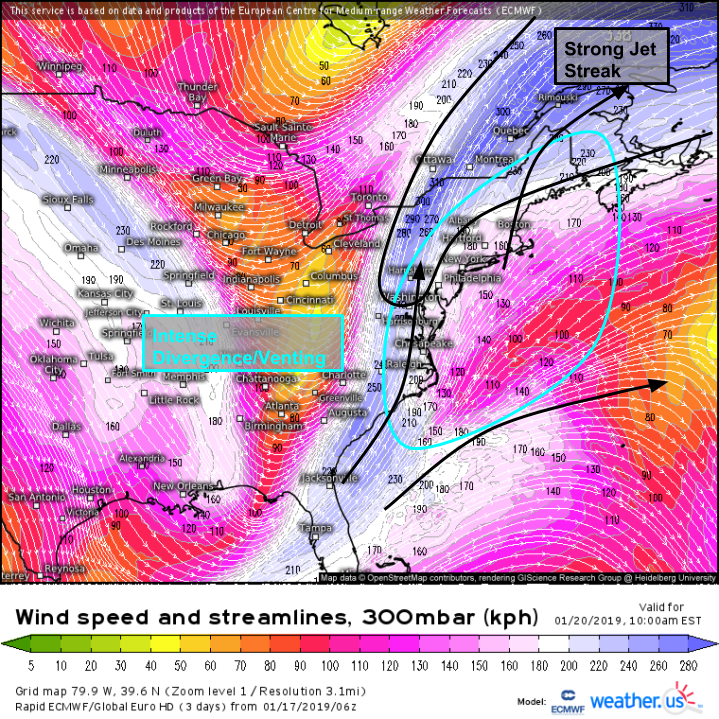
Let’s look a little closer at the 300mb jet, because it will end up contributing significantly to the rising motion responsible for the heavy precip. We’ll begin in Tampa Florida near the entrance region of a large jet streak (area of locally enhanced wind speeds). Imagine you’re a small parcel of air about 35,000 feet above Tampa. You’ll be moving swiftly off to the northeast for a little while, right next to all your neighbors, until you get to North Carolina. Once you arrive there, two things will start to happen. First, you’ll begin to acclerate into the even stronger part of the jet over New York and SE Canada, meaning you’ll be getting farther away from the parcel in front of you (which has already started accelerating) as well as the parcel behind you (which hasn’t gotten the speed boost yet). Additionally, you’ll make a turn off to the north while the parcels to your east turn even farther right. Thus you’ll also get farther away from your neighboring air parcels. Why is that important? The void between you and your former neighbors needs to be filled by some other parcel. Because you’re near the top of the troposphere, that air must come from below. That means warm moist air parcels from that tropical airmass are going to be rising, a recipe for condensation and precipitation! Map via weather.us.
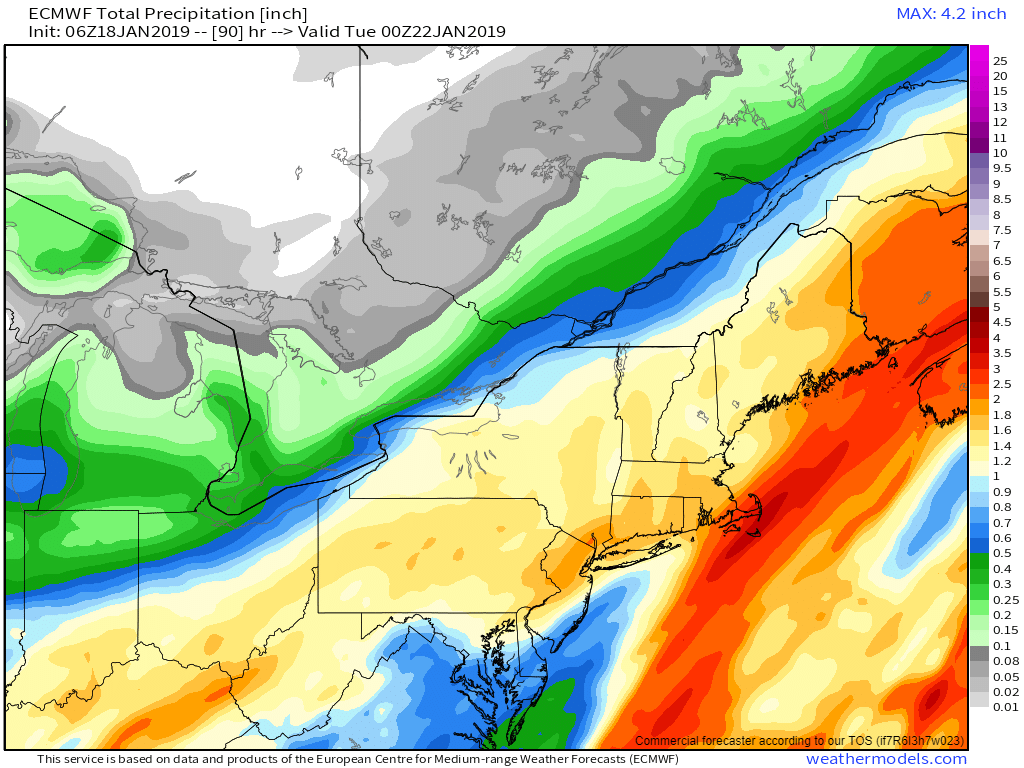
The strong jet dynamics, thermal clash, and tropical moisture availability means that precipitation will not be in short supply this storm. 1-2″ of QPF (rain or liquid equivalent of frozen precipitation i.e. how much rain you would’ve gotten if it all fell as rain) is likely across pretty much the entire Northeast. Parts of Cape Cod could do a bit better, while parts of the coastal Mid Atlantic might miss out a bit. The heavy precip isn’t the tricky part of this forecast, as you can see the atmosphere is telling us loud and clear that it’s coming. The tricky part is what that precipitation will reach the ground as. Rain? Sleet? Freezing Rain? Snow? Let’s see if we can figure that out. Map via weathermodels.com.
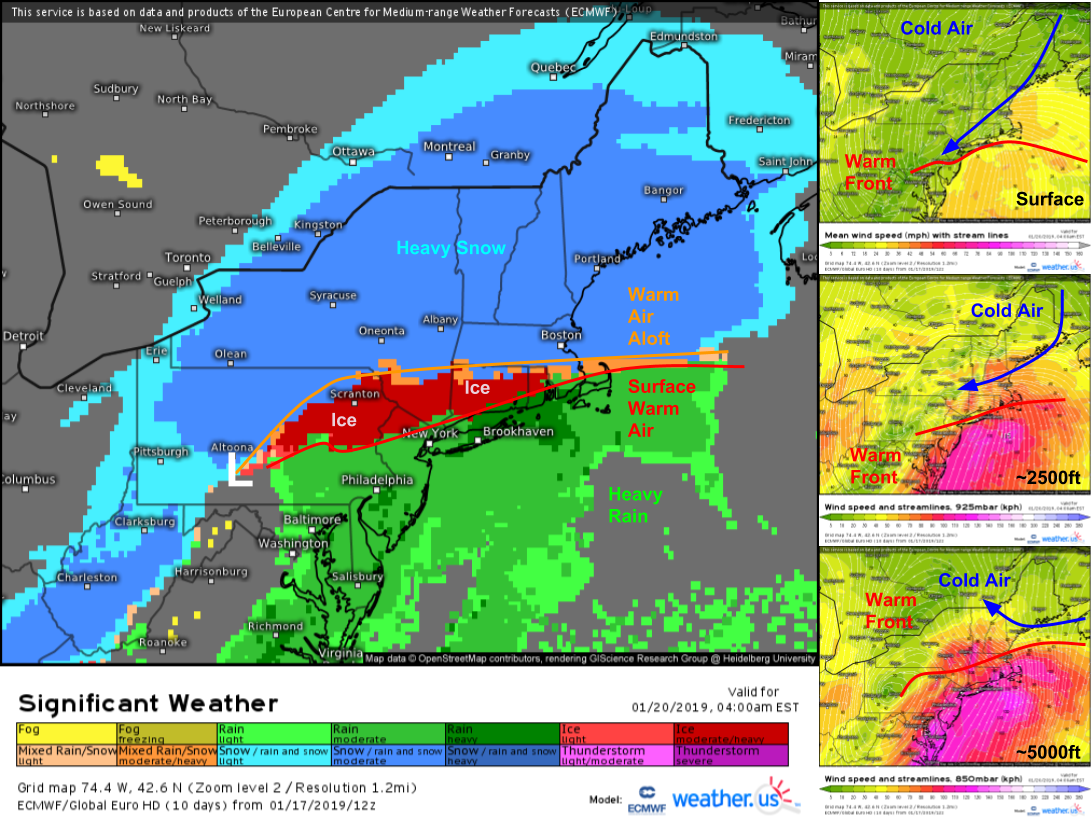
Here’s the basic precip type problem. Each panel on the right shows the winds at a different level of the lower atmosphere. The feature we’re looking for is the warm front, or the boundary between southerly winds and easterly winds. At the surface, that boundary is south of New England (this is for Sunday morning). At 2,500 feet, that boundary stretches from Trenton NJ to NYC to Cape Cod, a bit farther north. At 5,000 feet, that boundary is well north extending from Cape Ann to Springfield MA to Poughkeepsie NY and Scranton PA. Why is that important? It means that you’re going to have a layer of warm air around 5,000 feet that will melt any snow falling from above. However near the surface, temps are likely to be very cold due to that strong Arctic high pressure, so the rain will refreeze. The big question is will it refreeze as it falls (leading to sleet) or will it refreeze only once it hits the cold surface (leading to freezing rain). The answer is it depends on where you are. If you’re north of the front at 2,500 feet, you’re probably seeing sleet. If you’re between the surface front and the 2,500 foot front, you’re probably looking at freezing rain. Maps via weather.us.
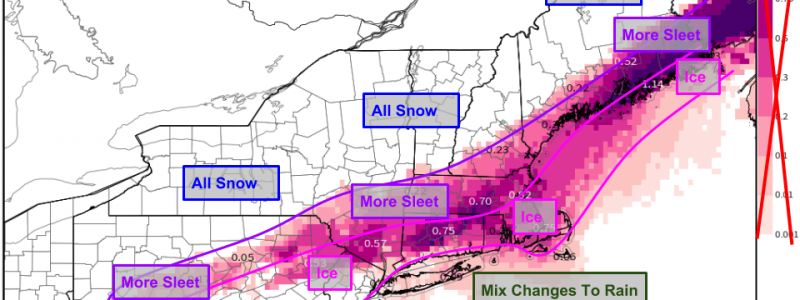
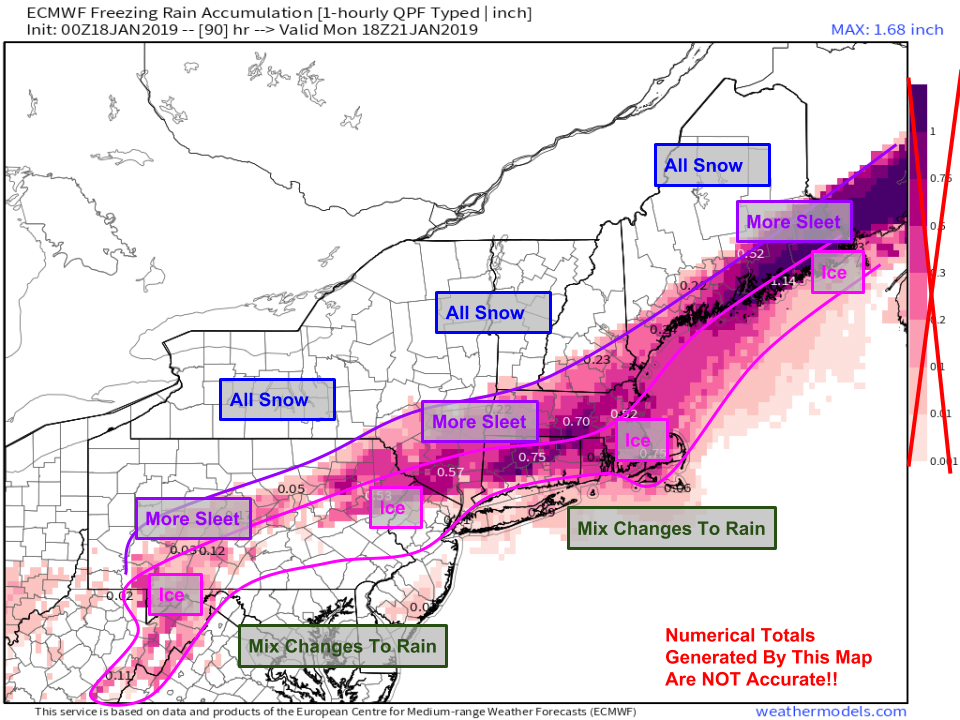
Let’s talk about this map for a second. It shows how much ice the ECMWF model expects to accumulate over a given area. Because it shows what would be a catastrophic ice storm for CT and MA, this map has been making the social media rounds this week. So is it true? Nope! To explain, we’ll need to take a quick detour into the physical sciences. If you’re interested in a quick lesson on some of the science behind the forecast, you’ll find this next paragraph interesting. If not, skip down for the reader’s digest version of what to expect.
Freezing rain is a self limiting process. As raindrops fall and freeze on contact with the ground (or trees or powerlines), they release what’s called latent heat of fusion. What’s that? Any substance in its liquid state contains more energy than that same substance in its solid state (so liquid water has more energy than solid ice). When the raindrops freeze into ice, the energy contained in that water decreases. But energy is conserved! So where does the excess go? The air! If you keep adding energy to the air, it starts to warm up. Of course each individual raindrop won’t warm the air up that much, but multiply that process over trillions of raindrops during the course of hours of freezing rain, and you very quickly can end up above 32 degrees, especially if the freezing rain is falling heavily. The map above assumes that any liquid which falls as freezing rain will accumulate at a 1:1 ratio (every 1″ of liquid falling as freezing rain ends up as 1″ of ice on all the trees/power lines etc.). But because of latent heat release, some of that liquid won’t be able to freeze to things, and will just end up on the ground where it’s slippery and dangerous for travel, but not dangerous for trees/power lines etc. All that to say, the maps we have on weathermodels.com are valuable forecast tools but they’re not infallible and sometimes you need to double check them against your understanding of how the atmosphere actually works.
With our detour into physics complete, let’s revisit the forecast. I’ve modified the above map to better reflect what I think will happen regarding precip type zones. I think the model is too warm at the surface for parts of PA and N NJ. The hilly terrain in these areas makes it hard to advect warm air in at the surface, and cold airmasses in this region are notoriously stubborn. So what the model thinks is plain rain will probably fall as freezing rain. In this area, expect between a tenth and a third of an inch of ice (NOT the .5-.75″ the model is “forecasting”!) Farther inland at the NW edge of the mix zone, the cold air near the surface will be deeper and thus what the model thinks is freezing rain will actually be sleet. Sleet is still slippery to drive on, and a huge hassle to shovel, but it’s infinitely better than ice in terms of power outages! Once you get into Northern New England and upstate NY, this one is all snow, and an extremely powdery snow at that.
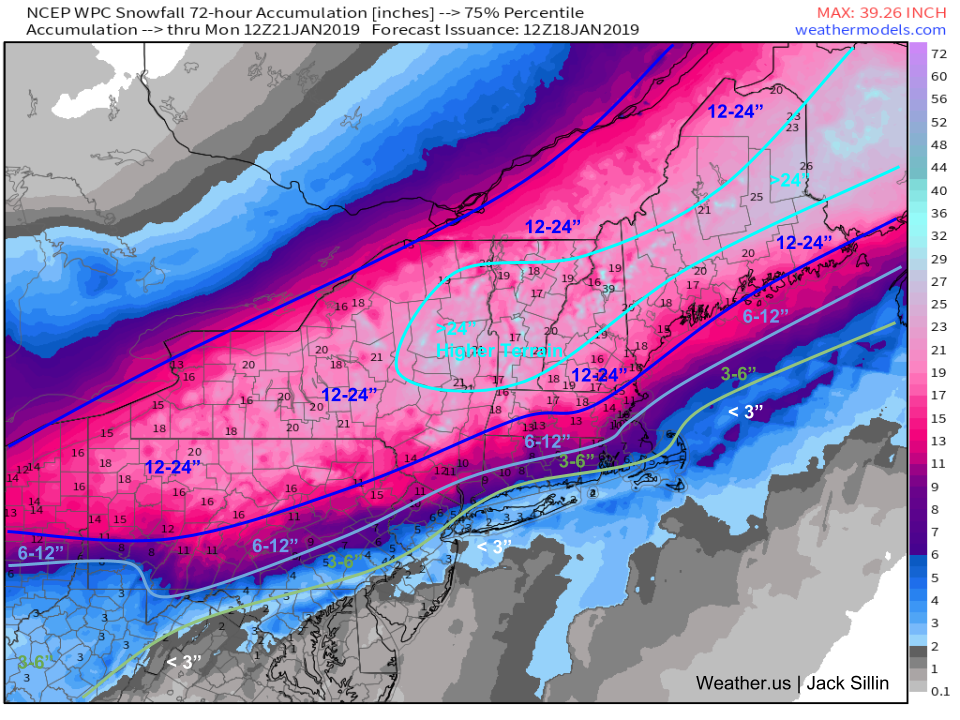
Now that we’ve talked about how much ice to expect, let’s talk snow totals. The jackpot for this storm will be found in the mountains of NY, VT, NH, and ME. Over two feet will fall in the higher terrain as extremely high snow:liquid ratios turn every 1″ of liquid equivalent into 20-30″ of snow. Slightly lower amounts will be found farther south and west, but the entire interior NE will get a good snowstorm out of this. Closer to the coast, totals are much trickier due to the mixing problems discussed above. Small adjustments in the mix lines will translate into big changes for the snow forecast. Right now I think the best odds of seeing a >6″ snowfall can be found from Boston down to Hartford and west through the Southern Hudson Valley/N NH/Central PA. Farther SE, temps may never get above freezing at the surface but warmth aloft and mixing with sleet/freezing rain will cut down on totals pretty fast. It should be noted though that a good “front end thump” right as the storm begins could put down some decent totals even at the SNE coast. Whether or not my thoughts here verify may depend on when you measure in these areas. The base map I used is the WPC’s 75th percentile forecast (25% chance of seeing more snow than these numbers) which I think best represents the totals inland where this is a fluffy snow. However it also is overdoing totals near the coast, which is why I’ve marked some supposedly 14″ locations as 6-12″ and some 8-10″ locations as 3-6″. Base map via weathermodels.com.
I’ll have more updates throughout the storm on twitter @WeatherdotUS and @JackSillin. Dr. Maue will also be tweeting away @RyanMaue. Follow the whole team for the most complete set of updates! You can also follow along with the storm yourself at weather.us with our various storm tracking tools.
-Jack



Hello from eastern N.C., that’s an outstanding write-up, thank you. I can tell you enjoy what you do, you’d make a great teacher or professor. Am adding your website to my weather folder.