Harvey Set To Bring Catastrophic Flooding To SE Texas
Hello everyone!
Harvey is moving inland across Southeast Texas this morning. Landfall occurred late last night just north of Corpus Christi. Nearly 8 hours later and the storm is barely 20 miles inland which is an indication of how this storm is stalling in very weak steering currents aloft. What does that mean for the storm’s future and for the forecast across parts of SE Texas?
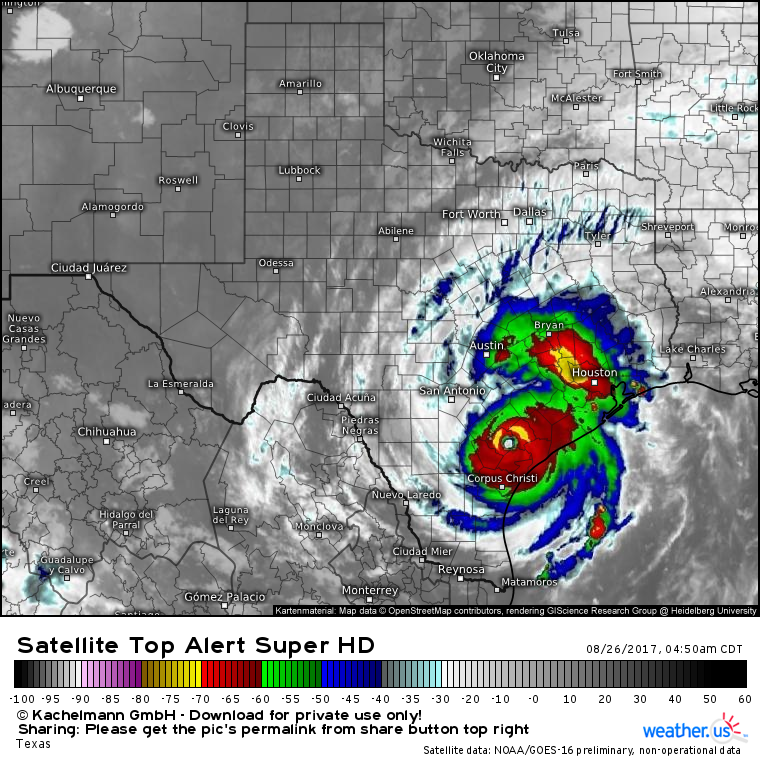
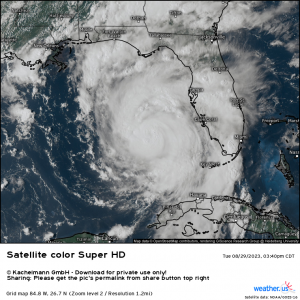
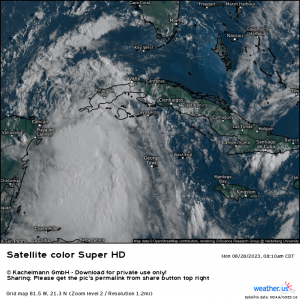
GOES-16 satellite loops show Harvey slowly drifting north not far from where it made landfall last night. For a storm that’s been over land for 8 hours, it’s still looking very strong. Cloud tops near the eye have warmed, but not significantly. Outflow in the upper levels up towards the Dallas area is still quite strong, and strong thunderstorms are noted in the storm’s outer bands, most notably in the Houston area.
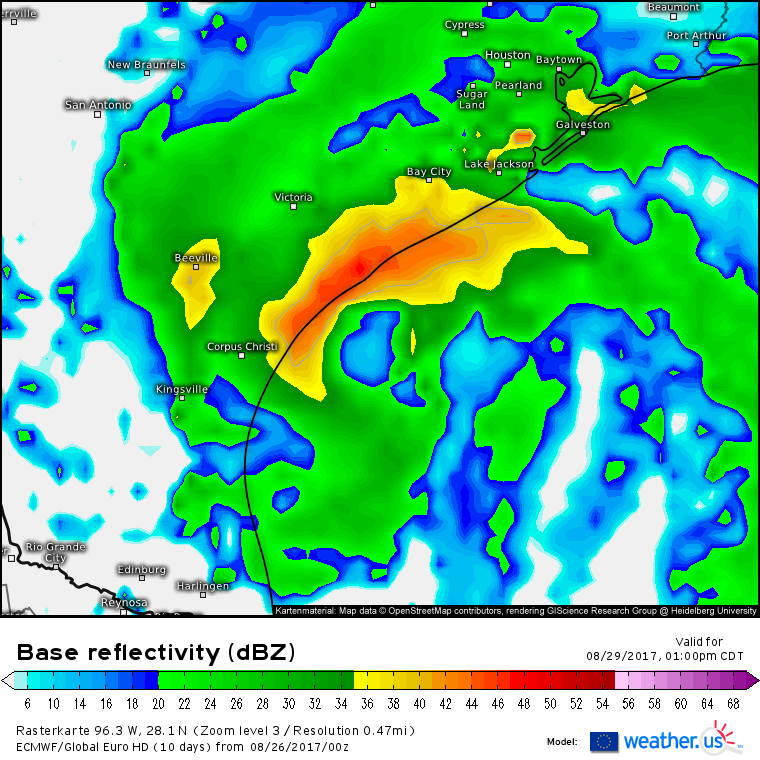
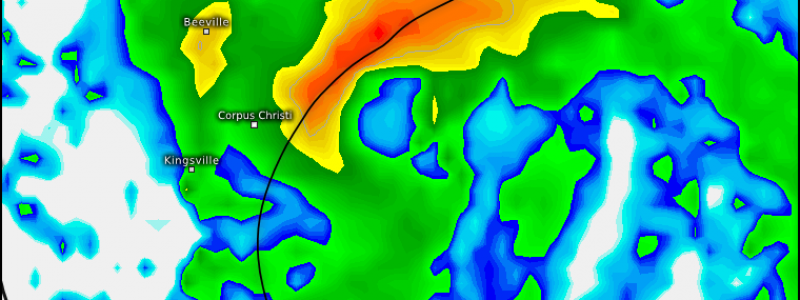
That outer band over Houston is causing a lot of problems. Remember that hurricanes are not singular points, their impacts span hundreds of miles and can impact areas that never catch a glimpse of the eye. We can see this band well using our HD radar product.
The Houston band has a history of producing tornadoes as it rotates ashore. Winds aloft are out of the southwest and winds at the surface are out of the northeast. This difference in wind direction with height is causing storms in this band to spin and occasionally produce tornadoes. If you zoom into county level and use the blue buttons at the top of the image to navigate to the velocity view (look for the tornado icon), you can see rotation in the storms coming onshore. When green colors (winds moving towards the radar) are located right next to red colors (winds moving away from the radar), you know a storm is rotating and could produce a tornado at any time.
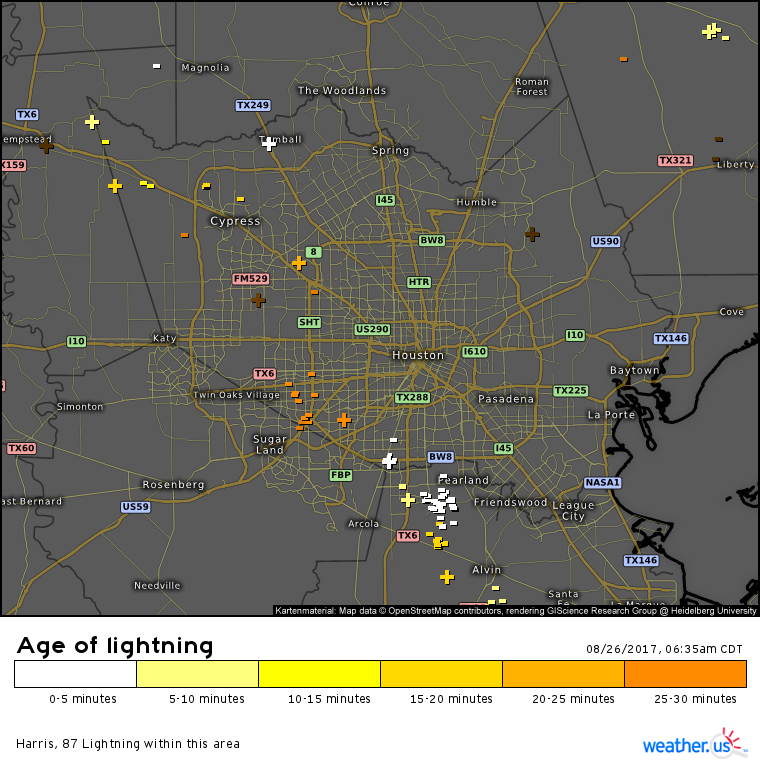
In addition to tornadoes, this band is producing tremendous amounts of lightning. Track each strike with our lightning analysis product!
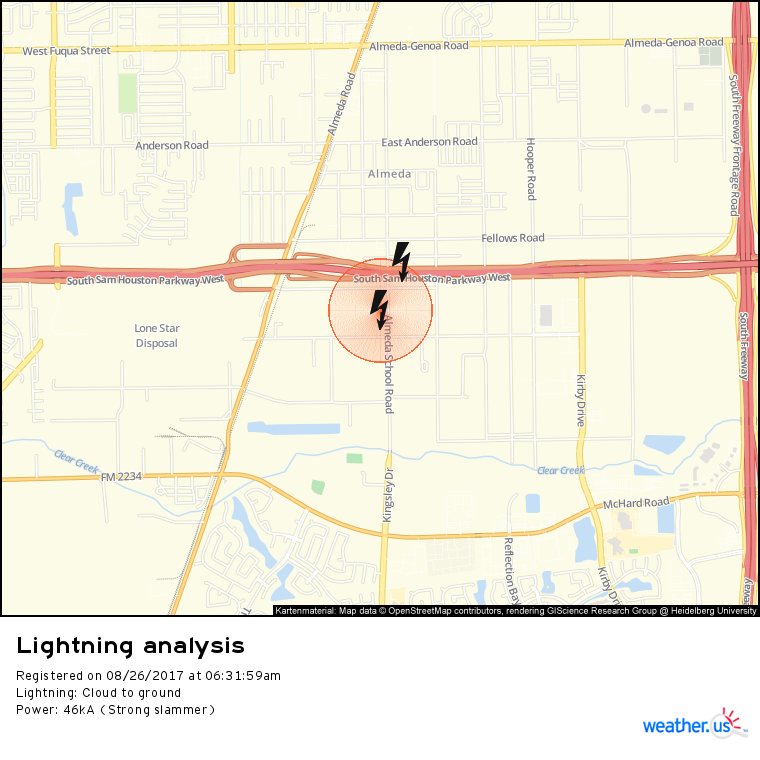
If you zoom into a county that has lightning in it, such as Harris county in Texas this morning, you can click on one of the plus or minus signs for much more information about a strike. The plus and minus signs are given based on the charge of the strike, which is either positive or negative. If you click on one of those icons, you’ll get much more information such as the magnitude of the strike, the time it struck, and its location down to street level!
As it moves over land, it’s winds will weaken. Hurricanes feed on energy from warm waters beneath them, so when you remove the warm waters, you remove the energy source, and the storm slowly weakens.
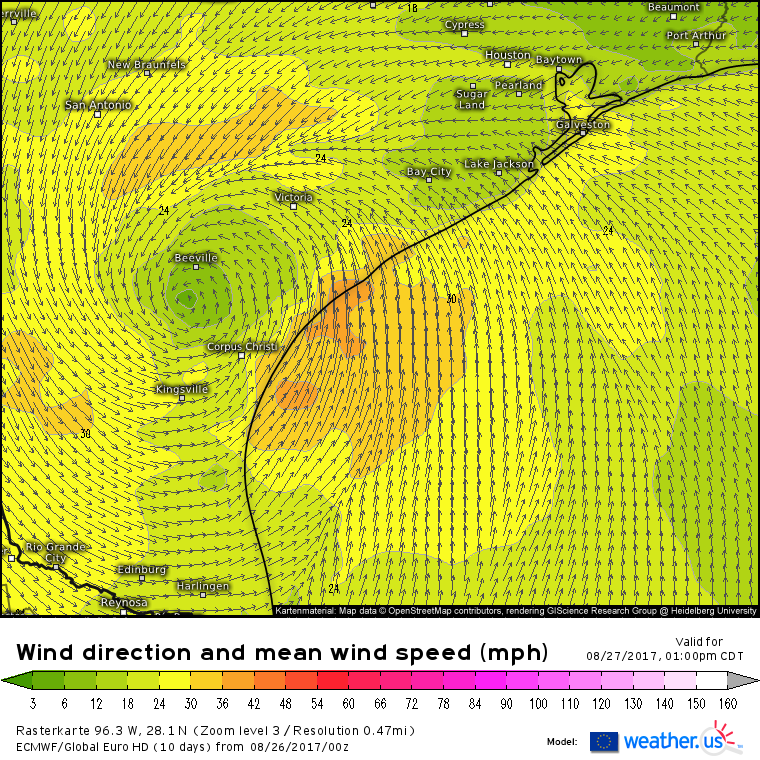
While Harvey’s winds at landfall were in excess of 130 mph, by tomorrow afternoon, the ECMWF shows the system barely hanging on to tropical storm strength (40+ mph).
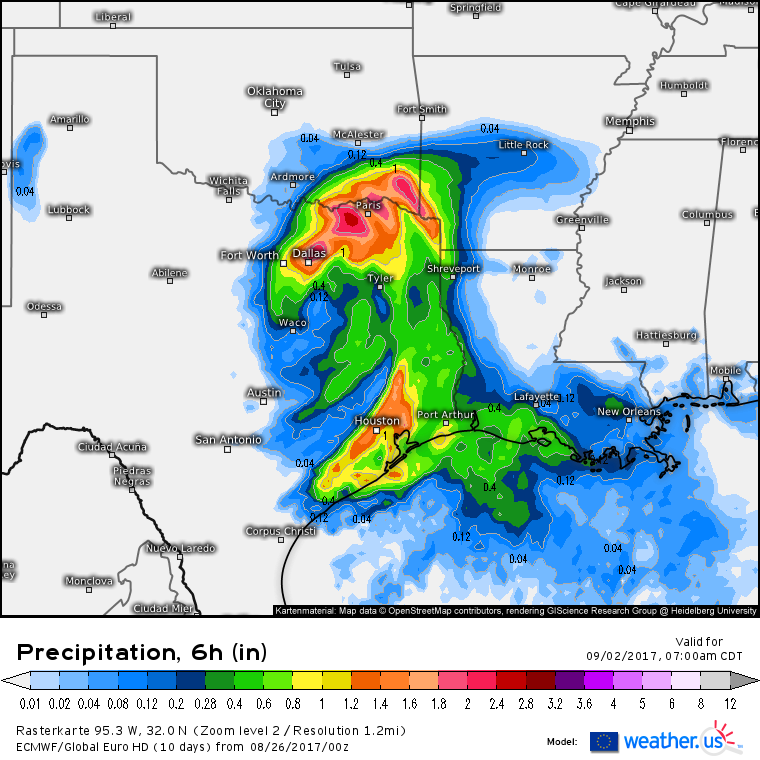
While the storm’s winds slow down, the rain will only pick up. I’m going to break down the flooding threat here using some of the new parameters just added to the weather.us ECMWF page. All the data I use here is available for free for you to use too! Just click the link and use the menus to select your desired parameter and forecast time. I’ll be using a custom map domain I created just for Harvey. You can do the same thing! Just select “Custom Zoom” under the “Map Selection” tab to the left of the upper part of the image. Then click to zoom the map into Southeast Texas, or wherever you want to look.
To get extreme flooding, you need three things. You need a lot of moisture, some way to turn that moisture into rain, and you need to have both of these things happen in the same place for a long time. We have checked all the boxes, and then some, for Harvey.
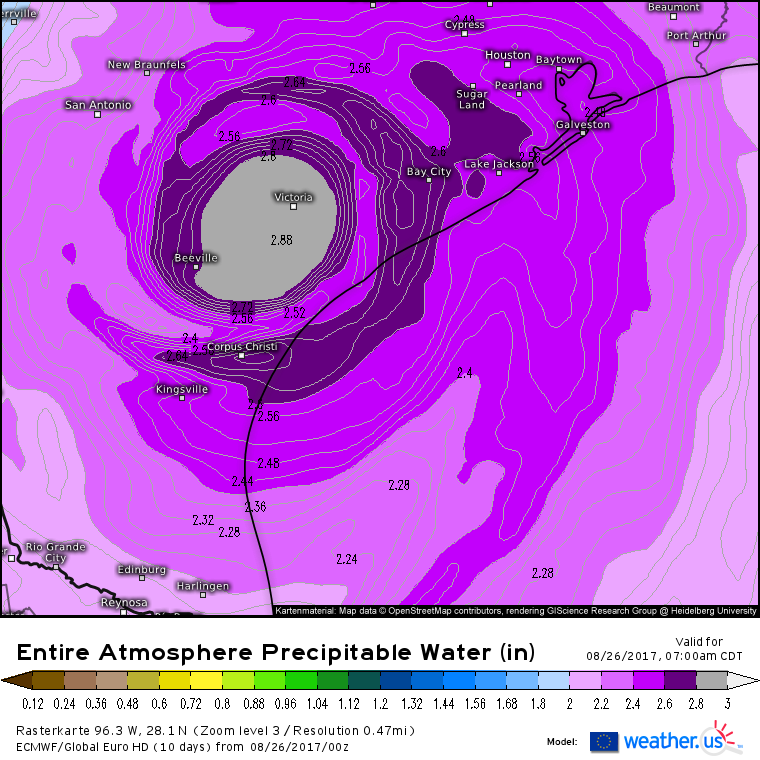
This parameter is called Precipitable Water, and it shows how much moisture is in the atmosphere. For frame of reference, PWAT values over 1″ are fairly supportive of rainfall. PWAT values in excess of 2″ constitute deep tropical moisture. What are the PWAT values in Harvey? They’re approaching 3″! All that to say, there’s a TON of moisture associated with this system. If you use the menus to step forward through the upcoming days, you’ll notice that this pool of very deep moisture doesn’t move a whole lot. In fact, by this time on Monday, it hasn’t moved at all. By this time Wednesday, it’s barely 30 miles northeast. For more of the intermediate time steps, check out the data yourself at weather.us.
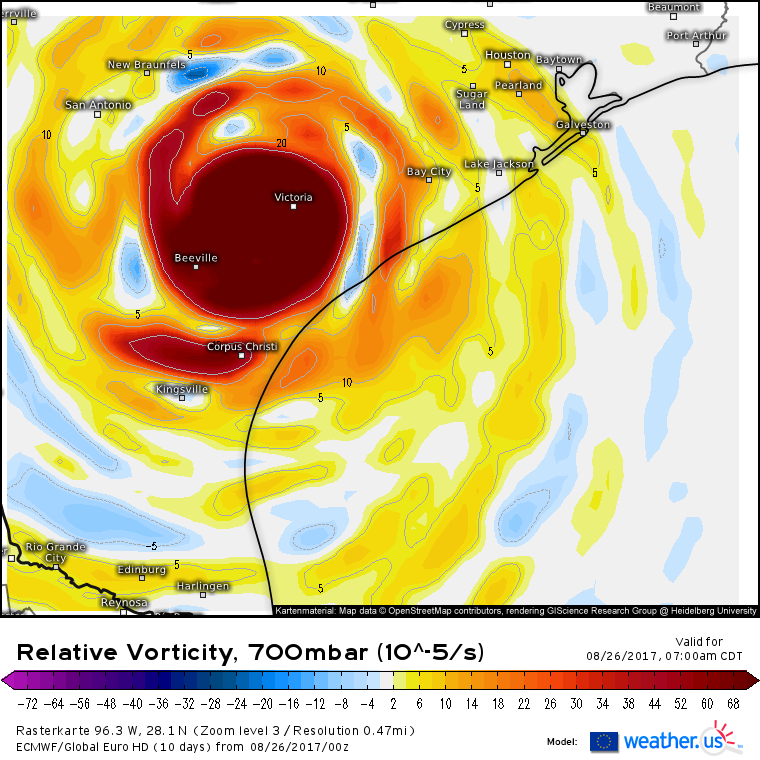
We have the moisture sitting over the same place for a really long time. How about the energy in the atmosphere to turn the invisible water vapor into very visible raindrops capable of catastrophic flooding?
It’s little surprise that tropical cyclones have a lot of energy associated with them. We saw one form of that energy last night which was the winds that raked the coast with 150 mph gusts. As the winds weaken, we’re going to see another form of that energy emerge which is the dynamics capable of producing incredibly heavy rains. Even as the winds weaken, the atmospheric energy that produces the torrential rains isn’t weakening at all. By this time Wednesday, our energy map looks almost identical to this morning. Guess what? Like the moisture, these dynamics aren’t in a hurry to go anywhere anytime soon.
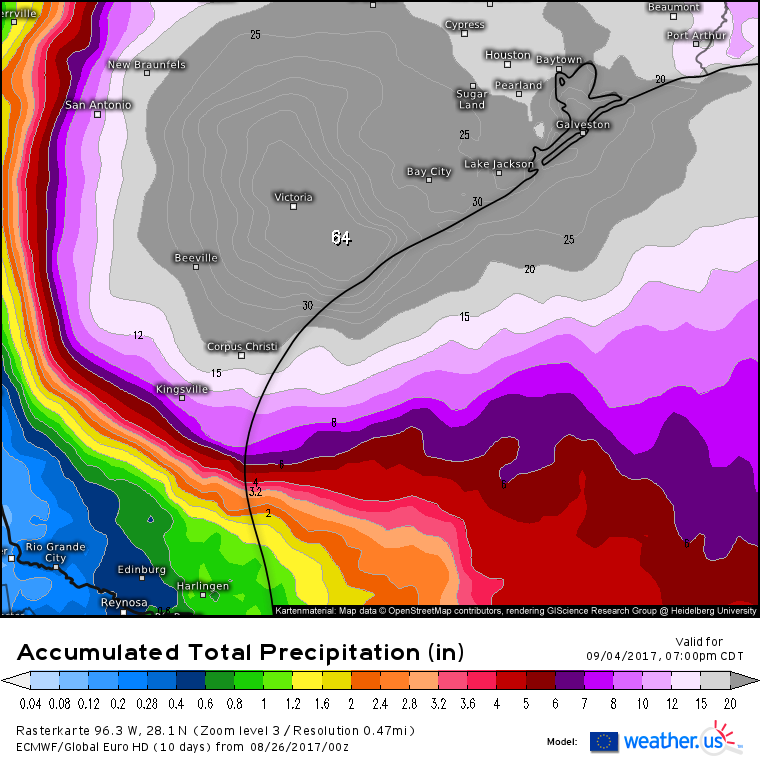
Just how much rain is this combination of incredible moisture and strong dynamics going to create?
It’s going to rain a lot from Harvey. There’s little else I can say or do to describe the devastating impacts that over 4 FEET of rain will unleash across this area. Note that this map only takes into account rainfall from 7 PM last night onward, some places near Corpus Christi have already seen inches of rain from the storm’s outer bands that moved ashore yesterday. While It’s hard (but not impossible) for me to see 64 inches of rain from this system, I do think it’s very possible to see over 4 feet of rain across a swath of the Texas coast from Houston to Corpus Christi and inland towards I-10.
What’s going to happen with the track of Harvey? It’s going to stall and drift across parts of SE Texas near Victoria today and tomorrow. It may start to drift back southeast as we head towards Monday and it may even re-emerge out into the Gulf of Mexico by Tuesday. That looked like much more of a sure bet yesterday, overnight guidance is less bullish on that idea. Given the weak steering currents and lack of any one force driving Harvey’s motion, I could certainly see it going either way.
The ECMWF model does forecast the storm to re-emerge out over water on Tuesday. If this happens, it would regain some of the strength it lost over land. How far out into the Gulf of Mexico it goes and how much time it spends over water will determine exactly how strong it gets, but re intensification into a hurricane can’t be ruled out at this point. Unfortunately, some model guidance including the ECMWF has Harvey making a second landfall in nearly the exact same place as it did last night.
When will the nightmare of Harvey end for Texas? Current guidance is giving a strong signal for “not this week”. Given the weak steering currents and the storm’s potential to regain some energy out over the Gulf, it wouldn’t surprise me at all to see a situation like the ECMWF depicts which is that the storm drifts slowly north towards Dallas with heavy rains not easing over the Houston area at least until next weekend. I’ll continue to have more updates in the coming days as we slowly figure out what the endgame is for this storm.
You can track every one of Harvey’s threats with the tools available at weather.us! Here’s a quick list of some of the things I’ll be watching today.
HD Radar imagery– watch Harvey meander over land as bands of extremely heavy rain rotate onshore. Click the map to zoom into county level for even more detail, or click one of the yellow circles to select a different radar location to see different parts of the storm, such as the powerful spiral band impacting Houston.
GOES-16 Satellite imagery- very shortly the sun will come up and we’ll be able to analyze visible satellite data, but until then we’ll need data from the IR sensor such as our Infrared view or the Top Alert option.
Model data- as we approach lunchtime, new model data will become available which will give us more insights into where Harvey may be headed in the coming days. I’ll have a full breakdown of that new dataset this evening, but you don’t need to wait for my analysis to check it all out yourself! I’ll be watching for new trends in data from the GFS, the German ICON model, and of course from the ECMWF.
Observations- watch the rainfall totals pile up either from weather stations on the ground or from satellite estimates, we have both available for free at weather.us! Also keep an eye on current wind speeds and gusts as the storm drifts through SE TX and potentially heads for a second landfall as we move into the upcoming week.
I’ll have more info throughout the day on Twitter and Facebook. I’ll be back here this afternoon with another full update detailing new information we get from the afternoon model guidance.
Have a great day and stay safe if you’re in the path of Harvey!
-Jack
