Dynamic Tropopause
Hello everyone!
There are lots of parameters that are used for forecasting the weather, some of which are intuitive (surface temperature, wind speed, etc.), and some of which are far from it. In this post, I’ll dig into one of the more confusing parameters, the Dynamic Tropopause Potential Temperature. There are two main concepts to discuss in association with this parameter, the Dynamic Tropopause, and Potential Temperature.
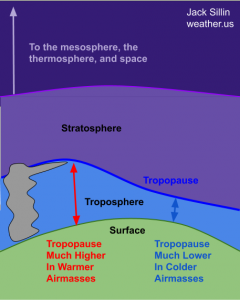
The tropopause the boundary between the troposphere and the stratosphere. The troposphere is the lowermost layer in earth’s atmosphere, and is where most of our weather happens. Air in the troposphere moves vertically in addition to horizontally, giving us periods of fair weather (sinking motion) and inclement weather (rising motion). Air in the stratosphere barely moves up and down at all, moving instead horizontally. The standard agreed upon definition of the height of the tropopause is around 10 miles above the surface in the tropics and around 6 miles above the surface at the poles (AMS Glossary – Tropopause). You’ll notice that this definition is temporally static (doesn’t change with time) and is only somewhat spatially dynamic (changes from equator to poles, as opposed to smaller storm-scale distances for example). The dynamic tropopause parameter calculates the height of the tropopause dynamically, taking into account changes over time and over smaller distances than from the equator to the poles.
The next question becomes what is potential temperature and why do we use it as a proxy for vertical distance? Potential temperature is defined as the temperature an air parcel would reach if it were plucked from some height (in this case the top of the troposphere, aka the tropopause) and dropped straight down to the ground. As air sinks, it warms via a process known as adiabatic heating, due to the increase in air pressure closer to the ground. As a result, the higher up the level your parcel starts at is, the more falling it would have to (theoretically) do to get to the surface. The more falling the parcel (theoretically) does, the more adiabatic warming it would (theoretically) experience, thus the higher its potential temperature value.
Let’s use the potential temperature on the dynamic tropopause surface to look at some of the dynamics associated with the transition of Alberto from a subtropical to tropical storm back in May of 2018. In the tropics, the potential temperature of the dynamic tropopause is right around 375K. There will be localized variations, but generally a tropical airmass will have relatively homogenous potential temperature values. In the mid latitudes, where contrasts in temperature are common, the dynamic tropopause varies in height, from about 300K to about 375K. We can use this information to see if Alberto is existing in a purely tropical environment (which would make it a tropical storm), or if it’s being influenced primarily by mid-latitude dynamics (in which case it would be a subtropical storm).
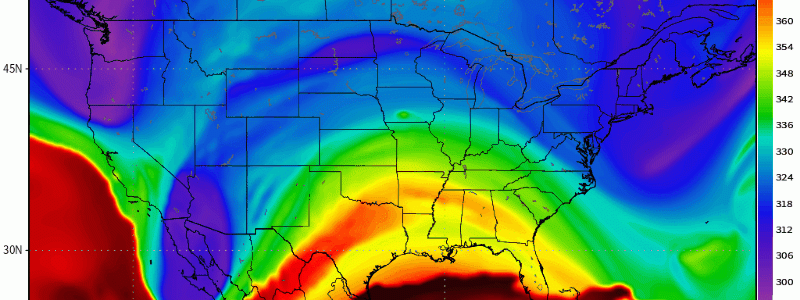
The DT map above (click to enlarge) shows a tongue of mid-latitude air dipping southward from Louisiana into the Gulf of Mexico. This mid-latitude air clashing with the tropical air over Florida is what had driven Alberto’s development up until this point. When a storm derives its energy from the clashing of airmasses, it is known as a baroclinic or extratropical cyclone. That said, thunderstorms near the storm’s center can produce their own pocket of ‘tropical’ air by releasing latent heat via condensation and freezing of water vapor lifted in the updrafts. This signature shows up somewhat as Alberto moved onshore in the Florida Panhandle. Note that while the DT is higher in the core than other parts of the storm to the north, south, and west, it’s still not nearly as high as the purely tropical airmass farther southeast.
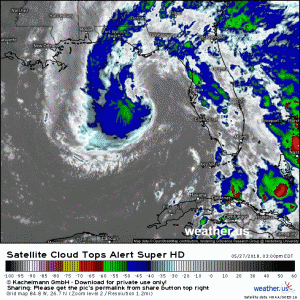 This satellite loop shows why Alberto wasn’t able to create a bubble of fully tropical air over its core. Note that there’s a lack of persistent and intense thunderstorm activity near the storm’s center. Without that activity, the storm didn’t generate enough latent heat to turn the airmass from extratropical to tropical. The NHC officially classified the system as tropical at landfall based on hurricane hunter data, but it was barely tropical at best. Ultimately the subtropical distinction comes down to more than just the dynamic tropopause height, but the DT is a valuable tool when looking at transitioning systems like Alberto. Tropical and extratropical transitions aren’t the only use for the parameter though, it also has important applications for wintertime forecasting.
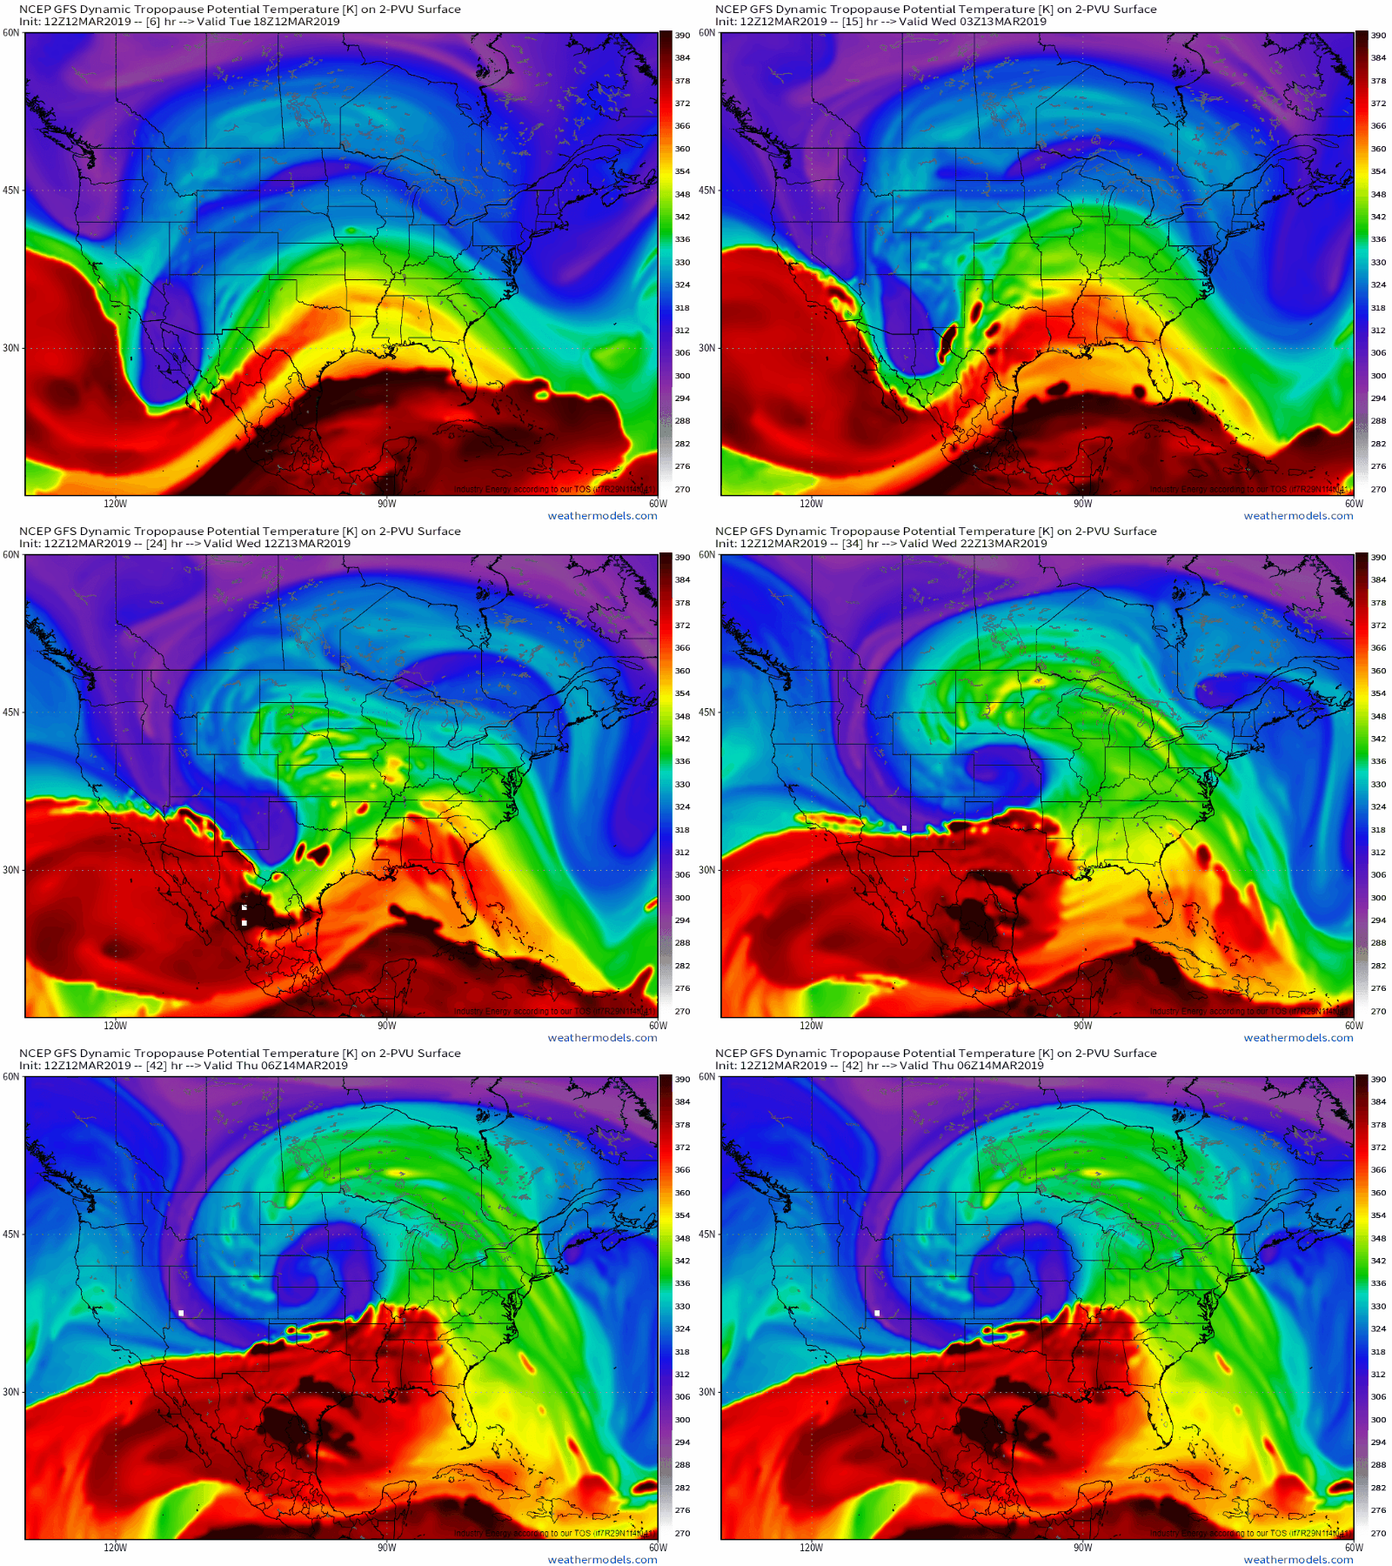
In the context of midlatitude forecasting, low DT potential temperature values are anything below ~315K which corresponds to the dark blue colors on the loop below. These values indicate polar air, while values below 285K which show up in white/grey indicate true arctic air.
This loop shows a textbook case of rapid cyclogenesis (storm development) over the Central US in March of 2019. This storm set several low pressure records in parts of the Plains as its pressure dropped into the 960mb range, roughly equivalent to a Category 3 hurricane. How did the storm get so strong so fast? The DT loop above offers several clues. Note the two pockets of very cold air at the beginning of the loop over the West Coast. These are each upper level disturbances that contain the energy needed to form a storm. As they join forces over New Mexico and merge into one entity, all that energy becomes concentrated in a small area, which was a key reason why the storm was able to become so intense.
Another contributing factor was the thermal gradient present through the entire atmosphere on the southern side of the storm. Note how the 370K tropical air is pushed right up against the 300K polar air over southern AZ/NM and adjacent parts of NW TX. That thermal gradient is another source of energy for developing cyclones.
The dynamic tropopause parameter can also be used to evaluate outbreaks of extreme cold.
Here’s a look at two DT forecasts for the major cold air outbreak in January of 2019. The cold came in two rounds, each of which showed up very well on DT maps. Trackable pockets of air with dynamic tropopause theta (theta is the Greek letter that represents potential temperature in meteorology) values below 280K are known as Tropospheric Polar Vortices (TPV’s for short). TPV’s can be thought of as bite size chunks of the Polar Vortex that sometimes escape into the mid latitudes (remember the polar vortex almost always exists above the high latitudes). When those TPV’s move south, they drag very cold air with them. Their leading edges are also favorable for cyclone development as the incoming cold air displaces antecedent warmer air and the natural thermal gradient along the East Coast between cold continental air and the warm Gulf Stream waters intensifies.
To wrap all this up, the dynamic tropopause theta parameter can be complicated to understand, but it can provide insight into many different weather phenomena ranging from tropical/subtropical cyclones to mid-latitude storms to outbreaks of Arctic air. One note of caution on the parameter is that the algorithm used by the model to identify the DT surface is sometime prone to errors. You’ll notice these as pockets of spurious values that don’t make sense either based on the location or the time frames before/after the image you’re looking at. One example of this is present in the maps above. Note the very high DT values south of Alaska on the right panel. These values are higher than most of what’s seen in the tropics south of Mexico. While some tropical air is indeed moving north in that region, it’s probably safe to assume that airmass isn’t more tropical than what’s over Baja California.
-Jack
