Bright Banding: Why It’s Not Raining As Hard As The Radar Says It Is
Hello everyone!
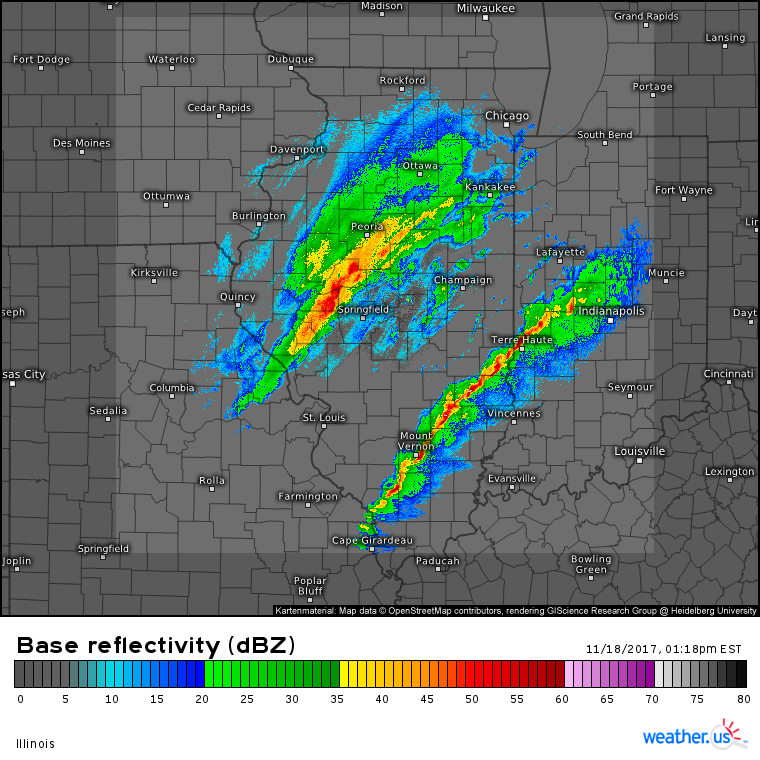
With mixed precipitation located so close to severe thunderstorms today in Illinois, it’s a great time to observe a phenomenon known as bright banding. Let’s see bright banding in action over Illinois.
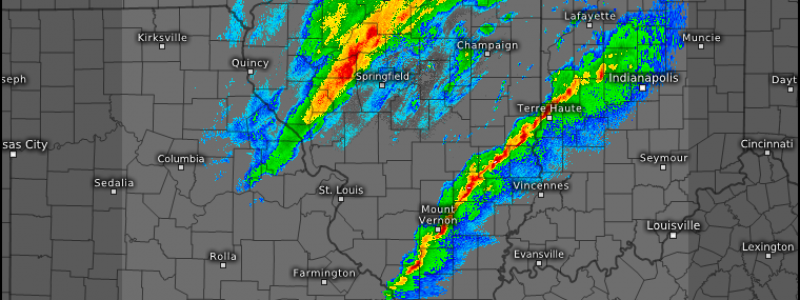
This radar image shows two lines of precipitation across Illinois. One is located in the southeastern part of the state, while the other is near Springfield. While they appear to have the same maximum intensity (both have bright red shadings indicating dBZ values near 50), there are a few subtle differences. The southeastern line has lighter precipitation spreading downwind of the heavier echoes, indicating a convective system with anvils spreading downstream of the updrafts. The northwestern line is embedded within a larger area of lighter precipitation that seems to have banding features oriented SW-NE. Overall though, on radar, the features look fairly similar.
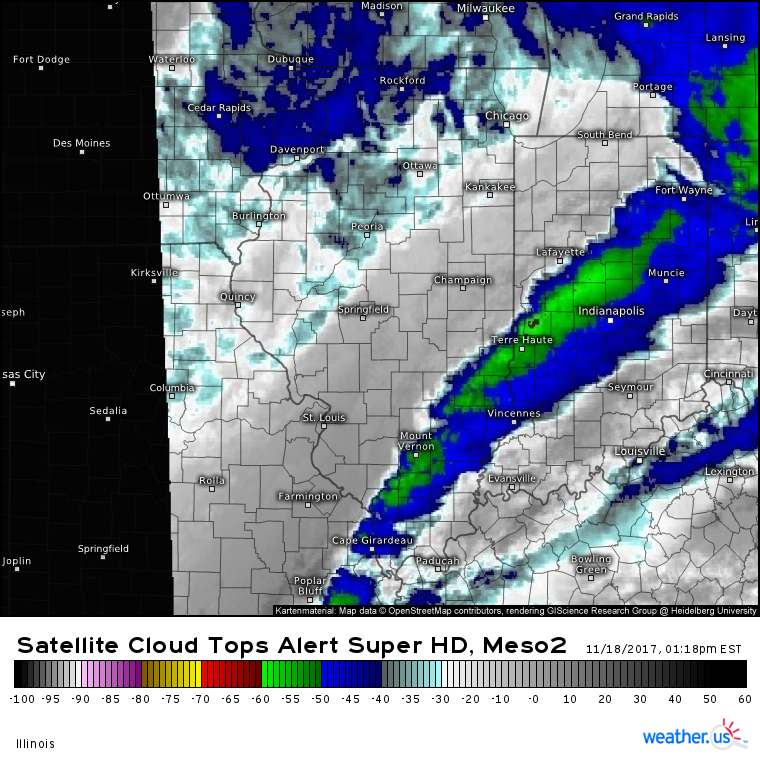
What does this setup look like on GOES-16?
This is GOES-16 1 minute Top Alert satellite imagery (what’s that and how do I use it?) taken at the exact same time as the radar image. The two lines of precipitation are clearly quite a bit different! The southeastern line of precipitation shows up very well as the area of cloud tops that are between -55 and -60C (there are even a few towers that fall below -60C). The northwestern line of precipitation is barely visible as an area of cloud tops that barely fall below -30C.
Surface observations confirm that rain is not falling at equal intensities in these areas. Observations from the southeastern line show “Heavy Thunderstorm” conditions, while areas under the northwestern line are reporting “Continuous Light Snow”. So what accounts for this discrepancy?
In the southeastern line, the radar beam is picking up on very intense rain that is forming and falling within intense thunderstorm updrafts. This is the radar operating under “normal” circumstances, where high radar return values (bright red colors) correspond to heavy precipitation. The much more interesting situation is occurring where the radar “disagrees” with the actual precipitation intensity. In this area, snowflakes are melting into raindrops as they fall into warmer air near the surface. As this happens, the snowflakes are congealing into larger clumps of half-melted rain/snow (like the kind you see right when snow changes to rain or vice versa).
These half-melted mixed rain/snow hydrometeors (a general term for water that falls from the sky) are exceptionally good at reflecting back larger than usual portions of the radar beam, because they have the size of very large snowflakes, but the water content of raindrops. When the melting process is complete, these clumps break up into smaller raindrops that fall at a normal rate.
So how can you tell that bright banding might be contaminating radar returns? Look for unusually heavy rain/snow in areas near the rain/snow line. In the winter time, bright banding is much more common than in the summer, when snowflakes melt long before they reach the radar beam. Snow rarely if ever falls at intensities that exceed 45 dBZ. If you see returns above 45 dBZ in a winter storm, it is likely due to bright banding.
Now that you know what bright banding is, watch our HD radar products to see if it’s happening in your area!
-Jack
