Assessing The Potential For An East Coast Storm Next Weekend
Hello everyone!
If you’ve been perusing long range model guidance, or have scrolled through the twitter/FB feeds of enough meteorologists, over the past couple days you’re probably aware that there may be a large storm off the East Coast around this time next weekend. If you’re looking for snowfall maps showing extreme totals in your backyard, happy hunting at weather.us or weathermodels.com. If you’re curious what the odds of a storm actually are, how much we know (and don’t know!) about the forecast at this point in time, and why the forecast is so uncertain, hopefully this blog will be informative.
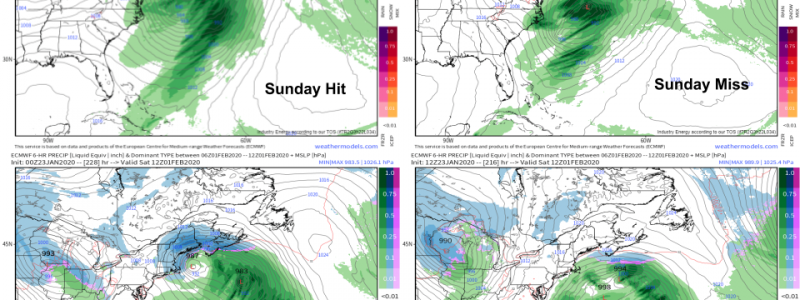
Since many of you have probably seen one (or all) of these maps before, let’s start with a quick review of recent ECMWF forecasts for this storm.
Each panel is one recent run of the ECMWF valid on the afternoon of Superbowl Sunday. As you can see, the range of possible outcomes for the I-95 urban corridor spans the full range from major snowstorm to flurries (out to sea miss) to heavy rain. Given the lack of consistency provided by the deterministic models, is there any useful information about the storm to be gained at this stage in the game?
The answer is yes, but we’ll have to look elsewhere.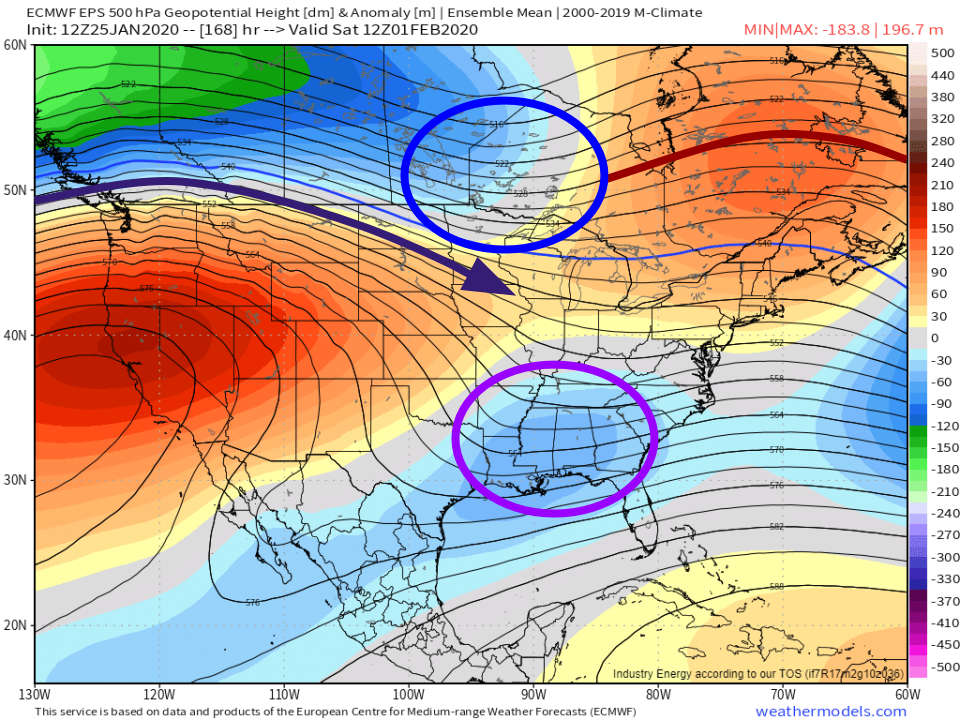
When looking at ensemble guidance, it’s common to start with the ensemble mean forecasts which simply take the average among all the ensemble members for a given time. The EPS ensemble mean forecast for 500mb heights next Saturday morning paints a picture somewhat favorable for an East Coast storm. A disturbance (area of lower heights) is noted over the Southeast while another disturbance is noted over Ontario. For a major storm to form, these disturbances would need to interact. In a typical East Coast storm setup, the southern disturbance brings the moisture while the northern disturbance brings the cold air. You can still get a storm from either one of the disturbances individually, but these ‘single stream’ storms tend to be weaker and less impactful. So will the disturbances interact? That’s still an open question, but the presence of a strong zonal (west-east) jet along the US/Canada border argues in favor of the disturbances remaining separate. It’s hard to get a system over Alabama to merge with a system over Ontario when both are being pushed more or less due East.
While ensemble mean guidance is helpful in identifying which features are likely to be present, we can extract a whole lot more information by examining individual ensemble member forecasts.
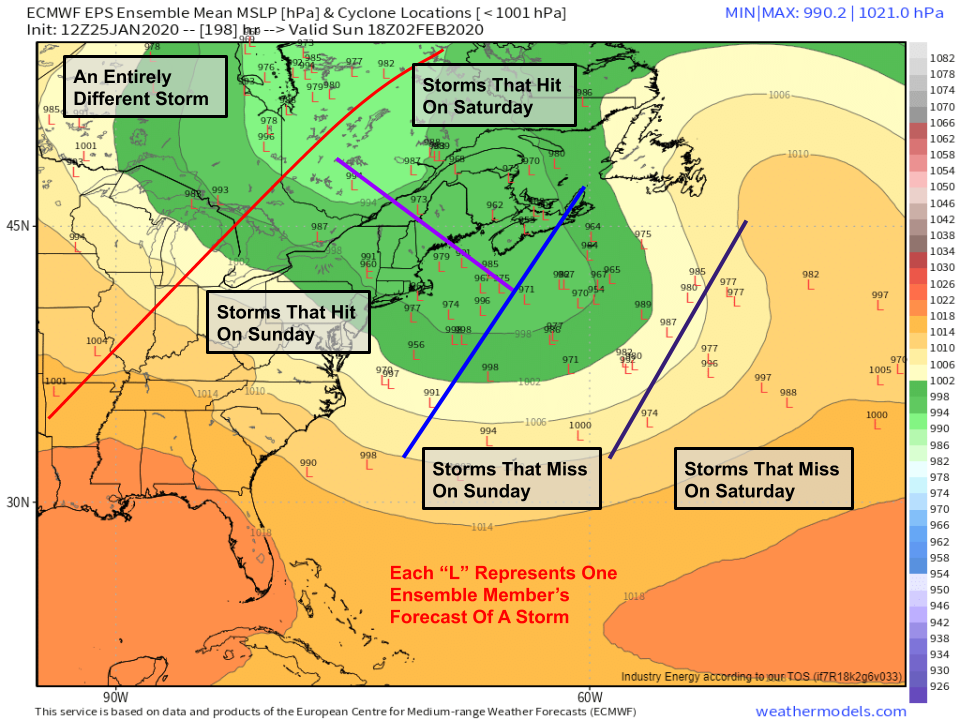
This map is one way of looking at ensemble data on an individual-member level. Each “L” on the map represents one ensemble member’s forecast of a storm. As you can see, our range of possible outcomes is quite wide! On Sunday afternoon, the storm might be as far west as the Saint Lawrence Valley, or as far east as the Central Atlantic Ocean. It might be as far south as South Carolina or as far North as the Gaspe Peninsula. It would be natural (and true) at this point to say we just don’t know where the storm is going to go. However, we’re not after a perfect forecast 7-8 days out from a possible storm. We’re after any clues that give us more information than “we don’t know”.
A close examination of the map above (and the frames that come before it) reveals four basic bins that storm forecasts can generally be separated into. Some members (roughly half) are forecasting a storm track close enough to the East Coast to bring impactful weather. These are the “L”s west of the blue line. Of these ‘hits’, some of them move up the East Coast on Saturday (ending up in Canada by the map’s valid time of Sunday afternoon) while others are still working their way up the coast on Sunday. A similar timing question is noted with the ‘miss’ storms, some of which have made it all the way into the Central Atlantic by Sunday afternoon, while others are still relatively close to the coastline (albeit racing east).
While it’s nearly impossible to decide which of these four bins our storm might fall into (let alone how strong it will be!), there are still some questions we can answer. What atmospheric processes are the ‘hit’ ensemble members forecasting that the ‘misses’ aren’t? Similarly, what happens in the ensemble members forecasting a Saturday hit/miss vs a Sunday hit/miss? By answering these questions, we can start to establish which atmospheric features will be important to watch over the coming week.
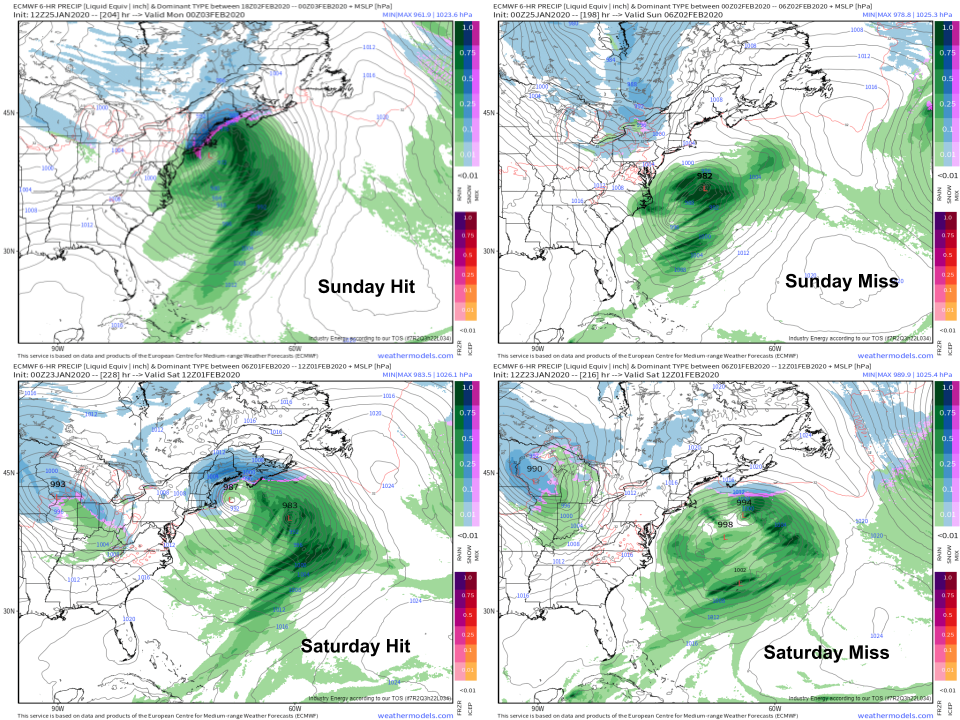
Normally, it’s best to use individual ensemble members to represent each scenario, but because each of these deterministic ECMWF solutions is well-represented by ensembles, and there are more parameters available to analyze previous deterministic runs, we’ll create an informal ensemble from four runs of the ECMWF for the purposes of this discussion. Evidently the final outcome in each run is quite different, but where do these forecasts diverge and why?
Because the area of surface low pressure doesn’t usually form until 1-2 days before the storm actually hits, we’ll be switching over to the 500mb pressure level for most of the rest of this analysis. By looking in the middle of the atmosphere, we can see the disturbances responsible for the formation of the storm long before the surface low actually develops.
Back towards the beginning of this post, I mentioned that we needed two disturbances to merge if we wanted a really strong storm. One of those disturbances brought the cold air while the other brought the moisture. Following the color scheme established in that discussion, the moisture disturbance is highlighted in each scenario forecast using a purple line while the cold air disturbance is highlighted in blue.
Unsurprisingly, each scenario treats these disturbances quite differently, but upon closer inspection some useful trends have already emerged. In each of the Sunday scenarios (hit or miss), the cold air disturbance (hereafter referred to as the northern stream disturbance or the northern disturbance) is located much farther north and east, somewhere in the Great Lakes/Quebec region. In the Saturday scenarios, that disturbance is much farther southwest, somewhere between the Central Plains and the Great Lakes. It’s important to make a mental note of that, because if we see something in the next few days that gives us a clue about where that disturbance might end up, we’ll know what to do with that information.
The hit/miss categories have a common thread too, but this time it’s much more closely related to the moisture disturbance (hereafter referred to as the southern stream disturbance or the southern disturbance). The hit scenarios have a much stronger southern stream disturbance oriented roughly N-S while the miss scenarios have a much weaker southern stream disturbance oriented roughly ENE-WSW. Again, this is important to note because as we continue to analyze this setup over the next few days, any clues that point towards a stronger southern stream disturbance will point us towards a stronger storm forecast and vice versa.
With that in mind, let’s take a look at where the discrepancies in the forecast for these upper level disturbances originate.
Here’s a comparison of what each scenario looks like on Thursday morning. Key features are highlighted in their respective colors, with a new lead disturbance (that gets lost in the noise by next weekend) shown in pink. The Saturday vs Sunday discrepancy in the northern stream disturbance’s speed is noted as early as Thursday when the disturbance is still over the Gulf of Alaska. This discrepancy is noted both in the hit and miss scenarios which adds additional confidence that it’s a robust signal.
The discrepancies in how each scenario handles the southern stream system are much more complex. A close analysis of the hit scenarios show the northern component of our disturbance (two disturbances will join to make the southern disturbance which may or may not join with another disturbance to form our storm) digging a bit farther south into the Plains on Thursday vs the miss scenarios. However, you’d be forgiven if you thought that disturbance looked like it was digging pretty hard on the Saturday miss scenario. Another layer of uncertainty is introduced by the southern component of this moisture disturbance. Even though the Saturday miss scenario shows a digging northern component, the southern component ends up so far southwest over Mexico that it gets left behind entirely, resulting in a weak southern disturbance and thus a miss.
If the last bit of analysis here lost you, that’s ok. My primary goal was to highlight a few reasons why different members of our informal ensemble produced such radically different forecasts. My secondary goal was to highlight how difficult it is to sort the signal from the noise in situations like this. I’ve only picked the features where I think the signal to noise ratio is highest. There are plenty of other disturbances that are important to some extent or another, but even after a couple hours of analysis, it’s not clear to me what the effect of those disturbances might be on the end forecast.
So can we actually do anything useful with this mountain of information we’ve generated? Yes! We’ve identified some features to track over the next few days both using forthcoming model runs and observations. As new information about these features comes in, we can start forming a better idea of what the most likely outcome will be.
Additionally, we now know that not all (theoretical) forecast possibilities for the upcoming storm have an equal probability. It’s true that Boston could see anywhere between 0-12″ of snow from this system, but that doesn’t mean each possible snowfall total within that range has an equal chance of actually being observed. In case that’s confusing, let’s visualize the idea graphically.
On this graph, each row represents one ensemble member’s forecast for snowfall accumulation in Boston over the next 15 days. As you can see, most members (35/51 or 76%) are forecasting an inch or less of snow through February 4th (after that is really anyone’s guess). This is the most likely outcome at this point. However, if there were to be snow, the odds of a significant >6″ event (6/51 = 12%) are the same as a moderate event of 3-6″ (also 6/51 or 12%). Put more simply, a snowstorm isn’t likely next weekend, but if such a storm were to form, the odds of it being significant are higher than usual.
As such, this won’t be the last post from me on this storm threat. Over the next week, I’ll have plenty more analysis both here and on twitter @WeatherdotUS and @JackSillin.
-Jack

