An In-Depth Look At Dorian’s Track Forecast
Hello everyone!
Hurricane Dorian remains an extremely dangerous Category 4 hurricane this morning as it approaches the NW Bahamas. Its track over the next 5 days will determine to what extent a large swath of the Southeast Coast will experience flooding rains, damaging winds, and storm surge inundation. This blog post will take a deep dive into Dorian’s forecast track and the process I’ve been using to attempt to figure out where the storm will go. The post will end with my personal track forecast.
This post is meant for those who have a few extra minutes today and are curious to learn more about the storm and/or weather forecasting in general. If you’re in the path of the storm and need a fuller suite of relevant information (timing/impacts/etc.) please refer to this morning’s second post and official NHC advisories. Remember that the thoughts here are mine alone, and for decision making advice please consult the NHC and your local officials.
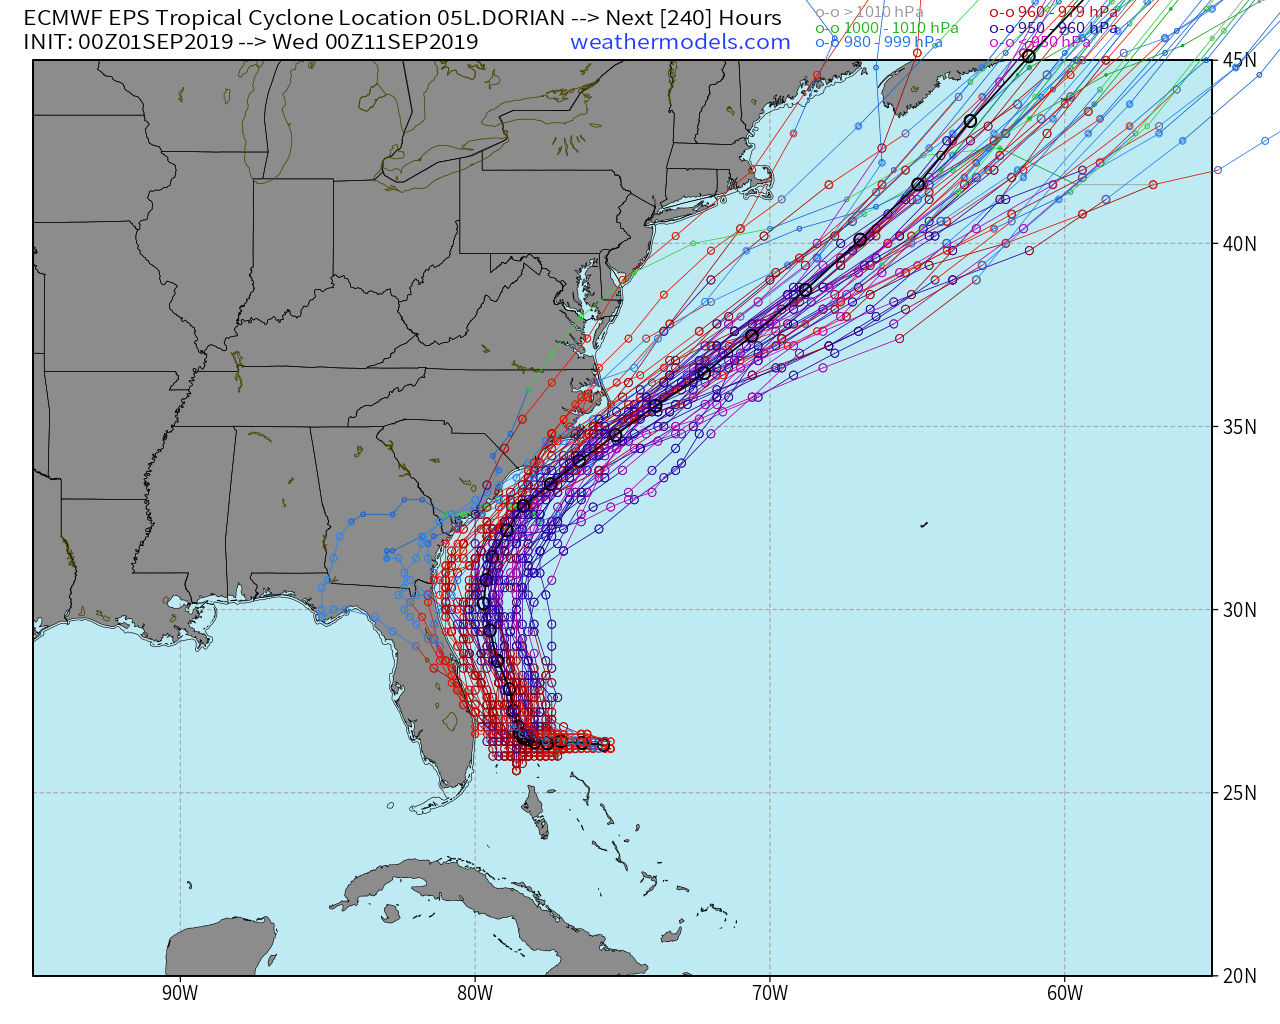
To start off, here’s a look at the range of theoretically possible outcomes for Dorian’s track. While the spread in ensemble guidance has narrowed considerably over the past few days, we’re going to need to do better than this to give residents of Florida, Georgia, South Carolina, and North Carolina useful information. You’ll notice that the possible outcomes on the left side of the range involve a landfalling major hurricane somewhere along the Florida East Coast. The possible outcomes on the right side of the range would take the storm far enough offshore that coastal Florida would barely notice its presence. Thankfully, there are some more clues we can look at to see which outcome is more likely. Map via weathermodels.com.
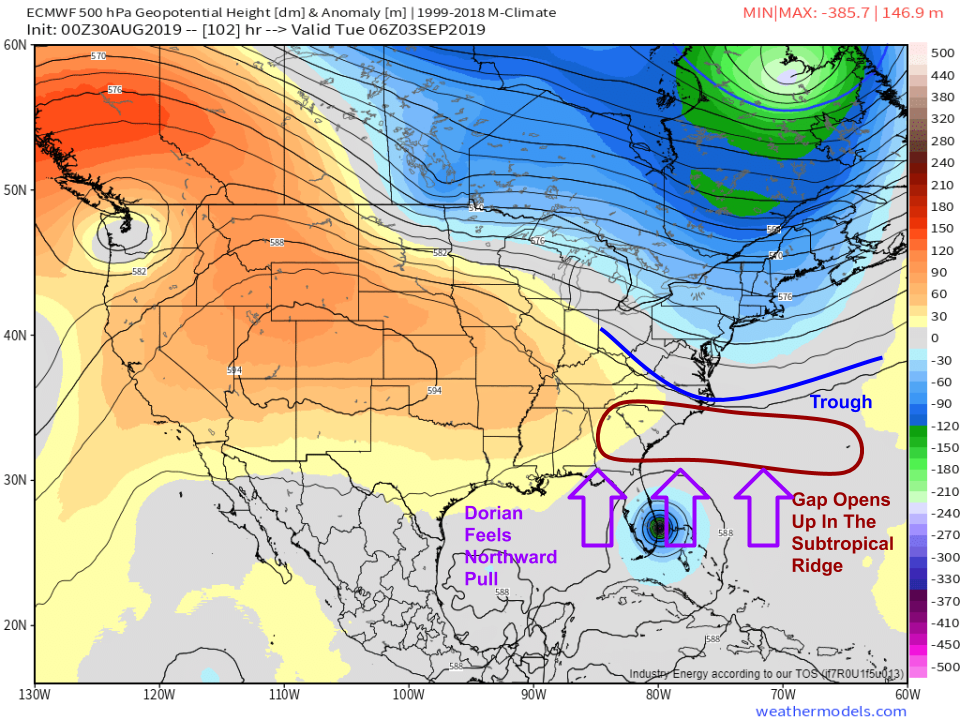
It’s been clear for several days now that Dorian’s steering near Florida will be determined by the extent to which an upper level trough moving through the Mid Atlantic can chip away at the subtropical ridge currently pushing the storm to the west. To figure out where Dorian might go, we need to figure out how strong the ridge and trough are. Map via weathermodels.com.
Thankfully, National Weather Service offices across the Eastern half of the country have been launching special weather balloons to sample the mid/upper level environment that includes both the ridge and trough in question. By comparing these observations to what the models have forecast to happen, we can see where the models are making errors and correct for them to produce a more accurate forecast.
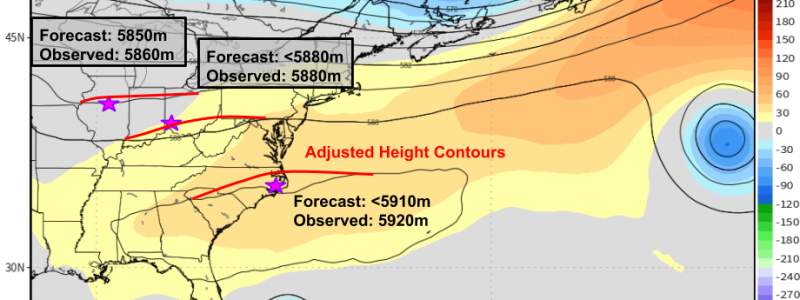
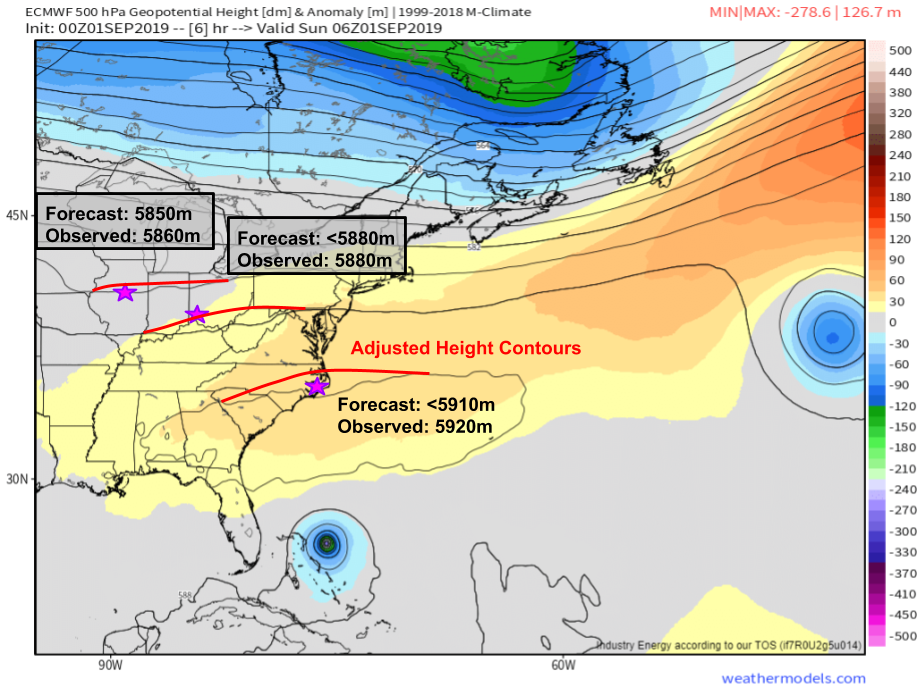
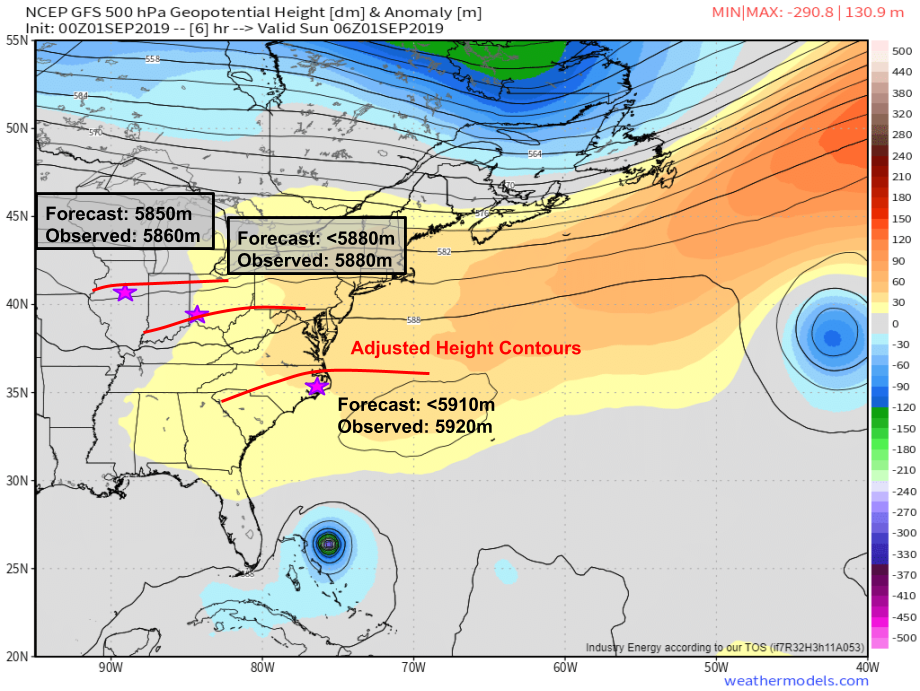
Shown below are the ECMWF (left) and GFS (right) forecasts for 500mb heights across the Eastern US and adjacent parts of the Western Atlantic at 2 AM EDT this morning (9/1/19). I’ve selected three stations (Lincoln Illinois, Wilmington Ohio, and Morehead City North Carolina) with upper air data for the same time, and compared the values.
Both models are forecasting heights that are too low both in the trough (over Illinois/Indiana/Ohio) and in the ridge (over North Carolina). The black lines on the map represent lines of equal height (above sea level of the 500mb pressure level). The ECMWF suffers from a low-height bias much less than the GFS does (note that the proper contours are closer to each station), but it still overestimates the strength of the trough and underestimates the strength of the ridge. This has serious implications for Dorian’s track forecast. Maps via weathermodels.com.
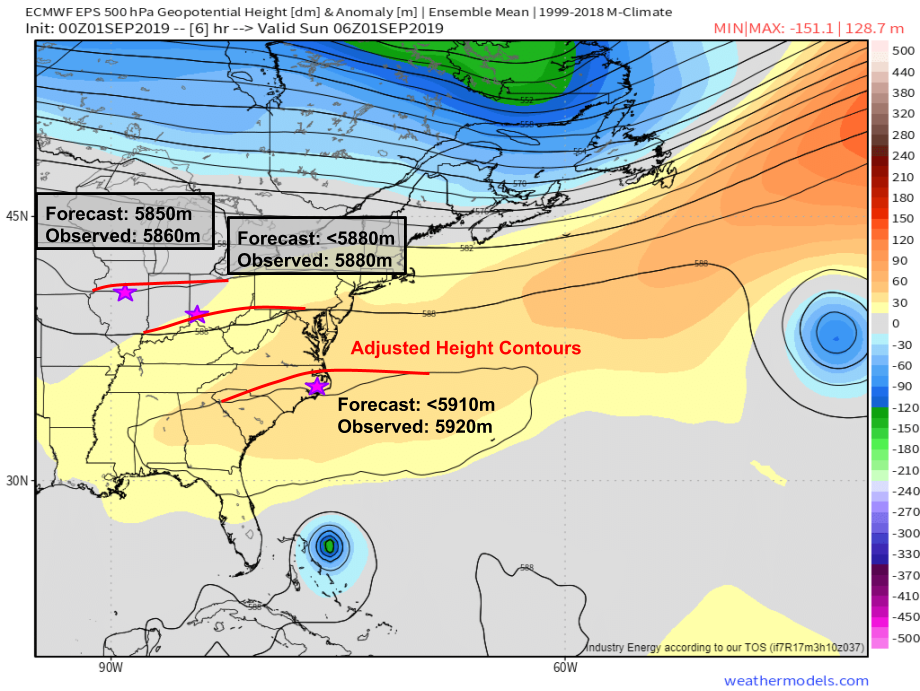
That being said, both the ECMWF and GFS are just deterministic models. That means they don’t capture the full range of possible outcomes, which is best left to ensemble guidance (hence why I started this post with an ensemble track map). What do the ensembles have to say? The ECMWF’s ensemble system (EPS) is the best we have available, so that’s what I’ll use for this discussion.
At first glance, the ensemble mean 500mb height forecast looks really similar to the deterministic models. It underestimates the ridge and overestimates the trough by almost the exact same amount as the ECMWF model. However, this is the mean forecast which means that some of the individual members will have higher heights (closer to what’s actually happening) and some will have lower heights (farther from what’s actually happening). By comparing ensemble members that show this variance, we can get a better sense of where Dorian might go. Map via weathermodels.com.
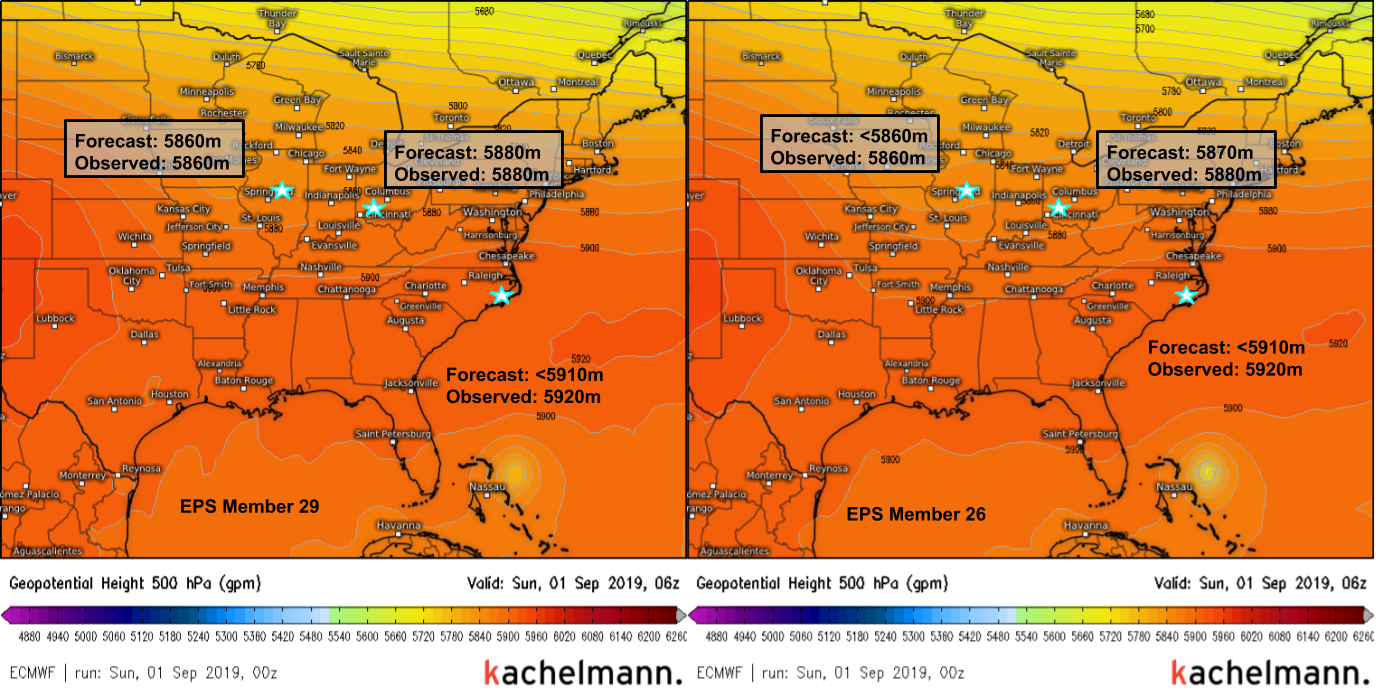
For the purposes of this discussion, I’ve selected EPS members 26 and 29, though you can compare any members you’d like at weather.us or weathermodels.com. EPS member 29 has 2 AM 500mb height forecasts very close to what’s actually been observed, especially regarding the strength of the trough. EPS member 26 is ever so slightly stronger with the trough and weaker with the ridge, similar to the deterministic models. So what do these members do with Dorian’s track?
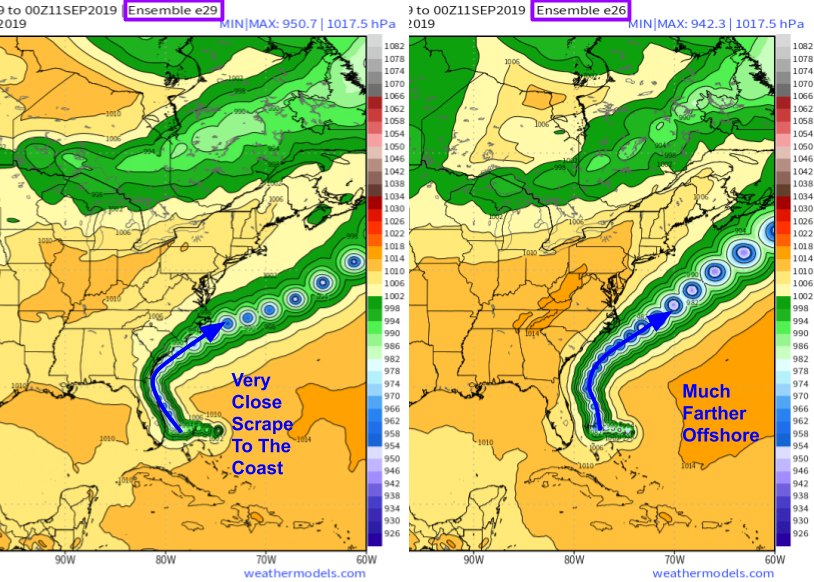
EPS member 29 reflects the western edge of the ensemble guidance envelope, taking Dorian on a track very close (within a couple dozen miles) of the Florida coastline before turning NE towards Cape Hatteras. Member 26 represents the center/eastern part of the guidance envelope, recurving Dorian to the north and east over 100 miles off the Florida coast. Maps via weathermodels.com.
Now that we know what’s responsible for the variation in model/ensemble tracks (differing forecasts for the strength of the ridge/trough) and we know which ensembles/models are doing a better job of simulating the currently observed state of the atmosphere (those with a weaker trough/stronger ridge), we can make a more helpful and informed forecast regarding Dorian’s track.
Here’s the same ensemble ‘spaghetti’ map I started the post off with, but this time I’ve annotated it to outline what I think is the range of possible outcomes based on the analysis done above. After stalling in the Bahamas tonight/tomorrow, I expect a turn to the NNW that brings the storm very close, or on, to the Florida coast somewhere north of West Palm Beach. After paralleling the Florida coast on Tuesday, the storm will turn ENE towards Cape Hatteras where it will either make landfall or pass just offshore before exiting into the Atlantic somewhere southeast of Cape Cod. Map via weathermodels.com.
Remember, there’s still some uncertainty in the forecast that is not attributable to the ridge/trough problem. We don’t know exactly where Dorian will stall, nor what small-scale wobbles it might take on its way north. But, by carefully analyzing the pattern over the East Coast and comparing what’s actually going on in the atmosphere to what models think is going on in the atmosphere, we can be more confident than we were before that the East Coast of Florida will experience strong winds, heavy rain, and storm surge flooding.
For more details on the timing/impact aspect of the storm, please refer to this morning’s other blog post and official NHC information.
I will have more updates on Dorian through the day on Twitter. I will also be doing a Periscope event on the @WeatherdotUS account at 5 PM EDT to discuss the forecast in more detail and answer any questions you may have.
-Jack




Thank You so much for this article!!!
Is there a link of a map showing actual track versus forecasted?
Thank you for taking the time to explain Dorian. You did a fantastic job ( still was a bit lost, but had nothing to do with your expertise) I live on St Augustine beach, in between the ocean and intracoastal, I’m mostly concerned about flooding. I evacuated to Gainesville where it’s looking pretty darn safe. If I loose everything, that’s pretty darn bad, but it’s only stuff and as long as we are all safe that’s really all that matters. Thank you again.
Misst
Nice article. I was a weather forecaster for 35 years, prior to retirement. I was the Subject Matter Expert for Tropical Meteorology, in the Department of Defense’s Weather Training Division. This is the military technical training school that taught operational weather forecasting to all enlisted weather personnel for the USN, USAF, USMC, and Coast Guard, worldwide. I would have liked to have seen two data sets…the 400mb winds, and the sea surface temperatures. With very light winds aloft, frequently the storm tracks are greatly affected by areas more favored for continued development. A thin ribbon of slightly warmer SST’s may well steer the storm against the 5-10kt upper level winds.