An Introduction To Atmospheric Rivers
Hello everyone!
Atmospheric rivers play an important role in some of the most impactful weather seen on the West Coast during the wintertime. They can bring feet of rain and snow in just a few days, and sometimes can last for nearly a week if conditions are right. So what are they and how do they get to be so impactful? That’s what this post will try to explain.
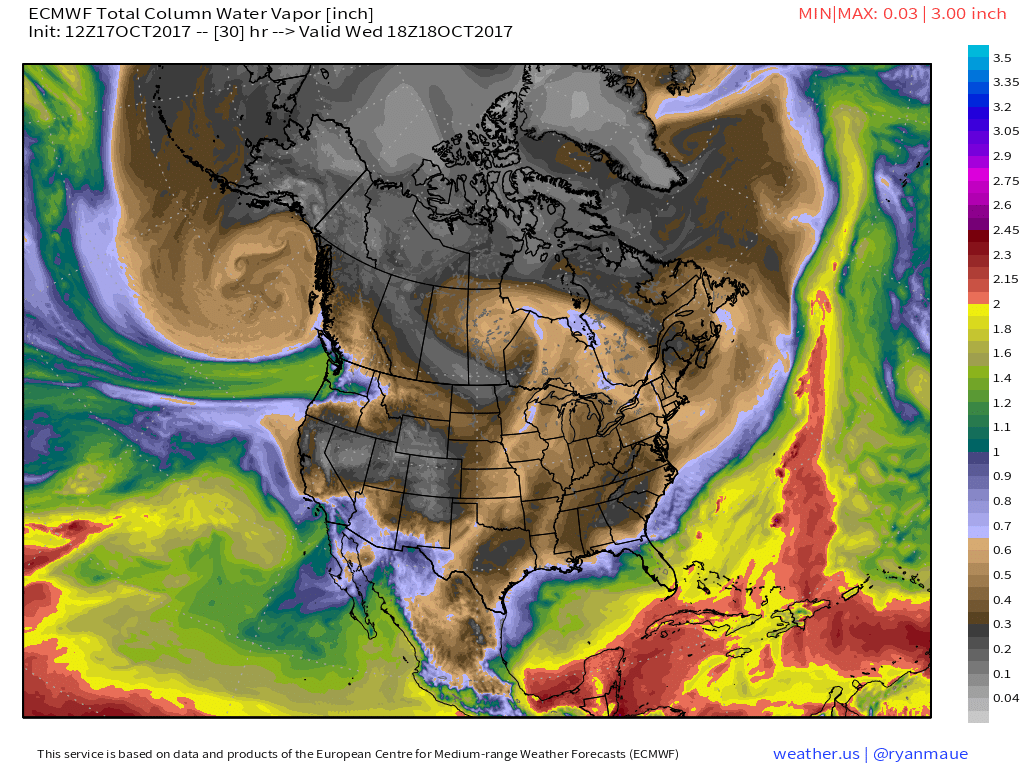
Atmospheric rivers are long and narrow streams of moving air in the atmosphere that transport moisture from the tropics into the mid latitudes. The map above shows two atmospheric rivers which are visible as long and narrow corridors of enhanced moisture. The first AR stretches from the Central Pacific Ocean into the Pacific Northwest and British Columbia. The second AR begins near Puerto Rico and stretches northeast into the North Atlantic. When these features interact with land, particularly land that is mountainous, very heavy precipitation often occurs. Because the flow of moisture is often parallel to the axis of the atmospheric river, lots of water passes over the same location much like in a terrestrial river. The result is often ‘training’ bands of heavy rain and snow that can drop astronomical totals over the course of several days. Map via weathermodels.com.
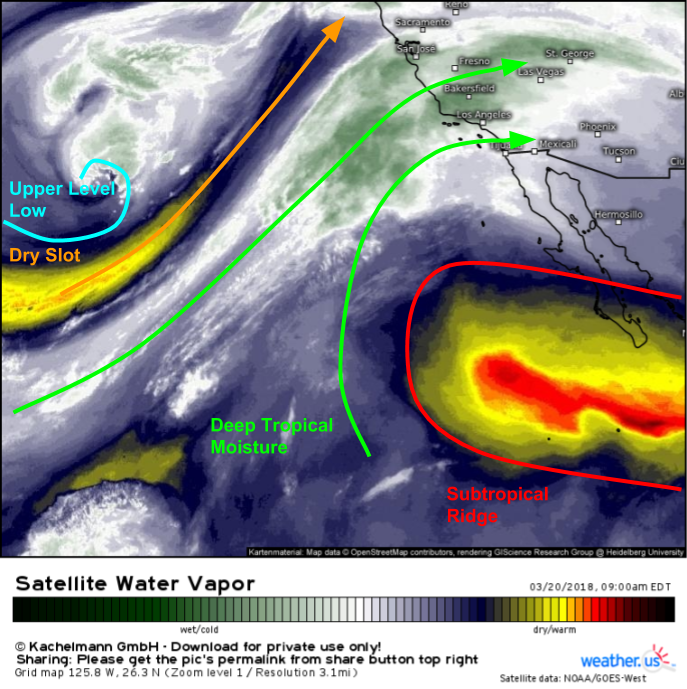
So what creates these long ribbons of moisture? Like most weather phenomena, there are many factors that contribute to the development of an atmospheric river. That being said, the two main ingredients are fairly simple and both visible on the satellite image above which shows an atmospheric river from March of 2018. To get a long corridor of enhanced moisture, you need a long corridor of winds blowing from a moisture source (usually tropical oceans) up into the mid latitudes. Often these winds are mostly southwesterly, though in some cases they may be more southerly or southeasterly and can even be westerly. A long corridor of winds blowing in a roughly consistent direction requires an area of low pressure on one side (in this case the northern side), and a large area of high pressure on the other side (in this case the southern side). The clockwise flow around the high will overlap with the counterclockwise flow around the low, creating the ribbon of winds needed to transport the moisture.
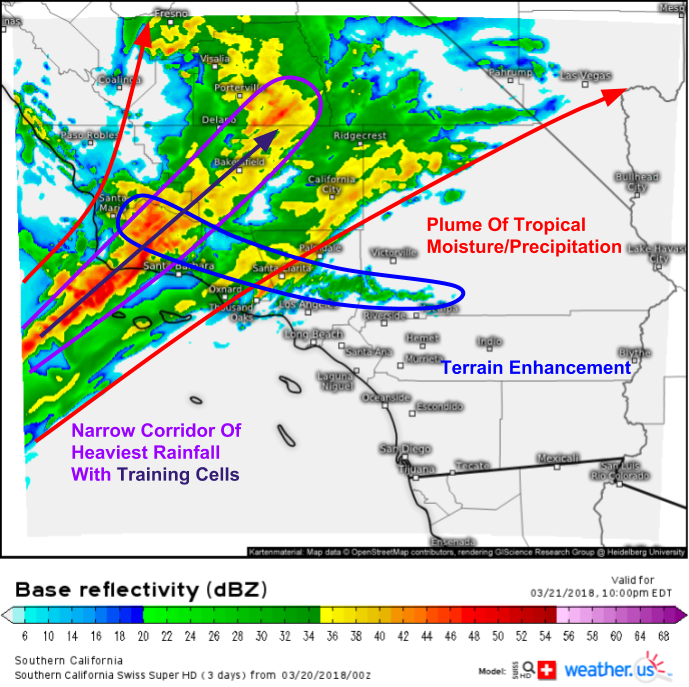
Our Swiss HD 1x1km model did a great job resolving the small-scale nuances of how the March 2018 atmospheric river interacted with the mountains of Southern California. As the river of moisture is forced to rise up and over the mountains, it cools and condenses into rain and (if temps are cold enough) snow. Even where there aren’t mountains, the lifting provided by the low pressure area north/west of the AR is often enough to produce bands of very heavy precipitation, such as those depicted off the Santa Barbara coast in the image above.
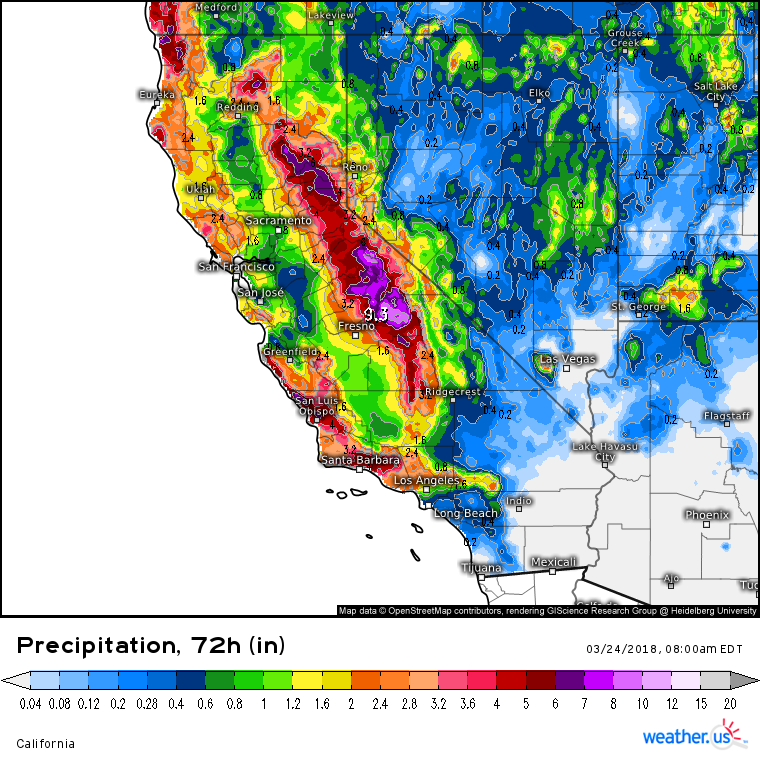
This map shows the radar-estimated precipitation values for the March 2018 event I’ve been talking about above. Note that the heaviest precipitation totals are found along the Sierra and Coastal mountains with much lighter totals in the Central Valley. Some of the more intense atmospheric river events to hit California in recent years have dropped much more moisture than the event shown above. In February of 2019 an extended atmospheric river event dropped over 15″ of precipitation in the Sierra Nevada, much of it falling as snow (click forward through the next few days using the arrow keys to see precipitation reports from the whole event).
Now that we know what atmospheric rivers are and what some of their impacts can be, how do we pick them out on forecast charts and predict them?
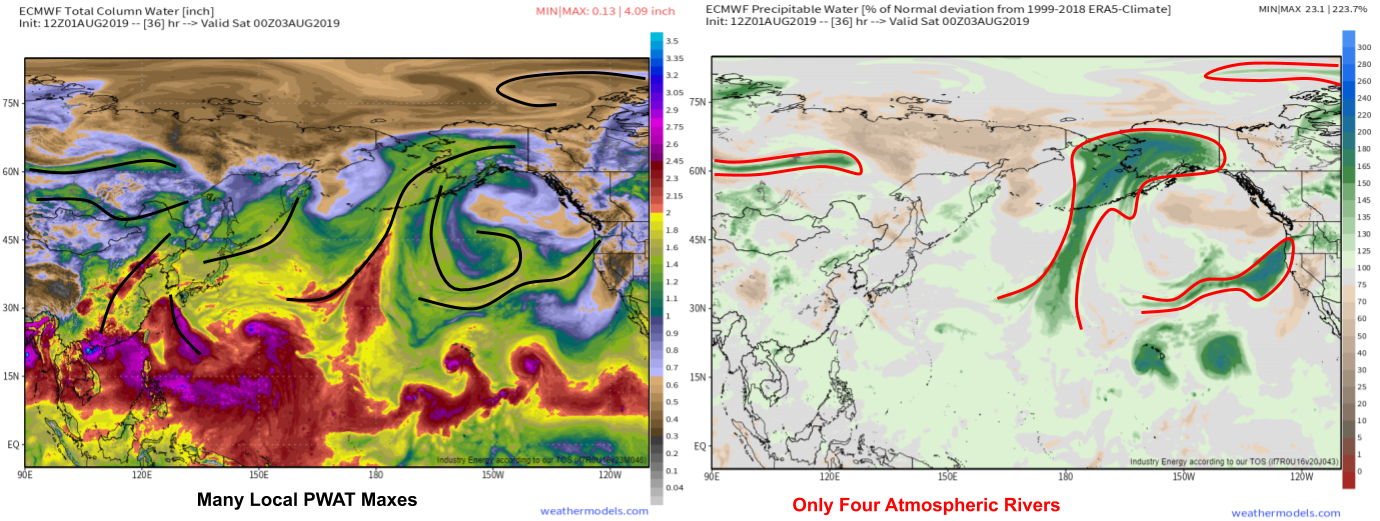
Atmospheric rivers will show up on precipitable water imagery, but how can you distinguish “normal” corridors of locally high precipitable water values from atmospheric rivers? The best way to easily see atmospheric rivers is to look for long and relatively narrow areas of precipitable water values that are not just absolutely high, but anomalously high relative to what’s expected for a given region at a given time. The best way to pick out these anomalies is to use the anomaly charts we have at weathermodels.com. like the one shown in the right panel of the image above. While the raw PWAT values (left panel) show many axes of locally high PWAT values, the anomaly plot very clearly highlights the four areas that would be considered atmospheric rivers.
Why do the AR’s show up so well on the anomaly plots vs the raw value plots? The answer lies in the fact that a defining characteristic of an atmospheric river is its transport of large amounts of moisture towards the poles (where moisture isn’t typically found). If an area that shouldn’t normally see a lot of moisture (take Alaska for example in the images above) is seeing a lot of moisture, it has to be coming from some distance away via the transport processes of an atmospheric river.
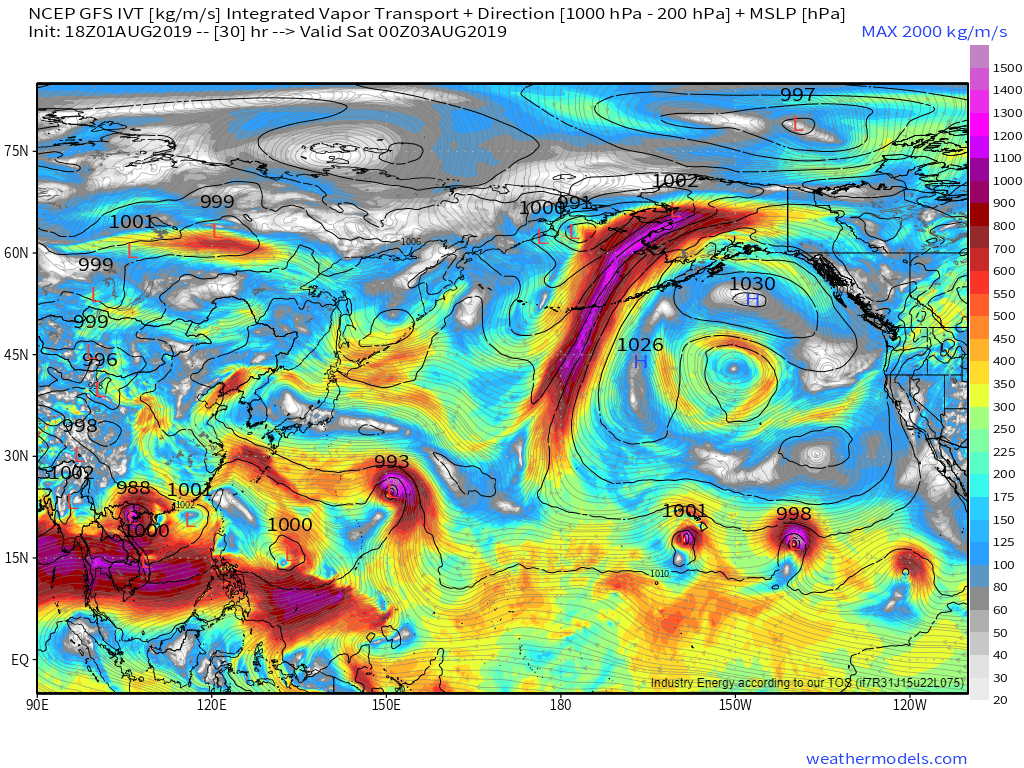
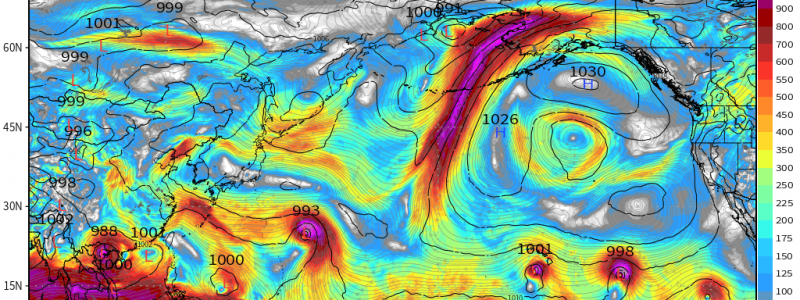
If you were to look up a technical definition of an atmospheric river, you’d most likely find an answer defined in terms of the parameter shown in the map above: integrated vapor transport. This is a way of measuring how much water vapor is moving from one place to another. This map is valid for the same time period as the forecast maps above, and each of the atmospheric rivers that showed up on the anomaly plot show up well here. The IVT maps are a good way of gauging the relative strength of atmospheric rivers. After all, a stronger AR will be moving more water. The Alaska AR clearly shows up as the most intense feature over the North Pacific, while the Russian feature comes in a close second. By the time of this forecast map, the AR aimed at British Columbia has already moved ashore and weakened, so while the moisture it already moved is still around (and shows up on the anomaly maps), it’s not moving much water anymore. The feature over the Arctic Ocean falls into a similar category having peaked in intensity several days ago. Map via weathermodels.com.
Now that you know more about atmospheric rivers, be sure to watch for them using our weathermodels.com and weather.us model forecast maps. If one is headed your way, follow along with its progress using the satellite and radar tools at weather.us.
-Jack
