Frontogenesis: What It Is And Why It’s Important To Forecasting Mid-Latitude Precipitation
Hello everyone!
I know it’s the middle of summer, but between all the snow events, I didn’t get around to writing this blog when it would’ve been most timely. Thus this will live in the “Weather Encyclopedia” section of the blog as reference material for when we get into winter storm season. If you ever don’t understand something I write or discuss in my blogs/videos, check the encyclopedia first, there’s a (somewhat decent) chance you can find a relevant explanation in the encyclopedia. If not, send me a note via email (jack@weather.us) or twitter (@JackSillin) and I’ll put it on the list.
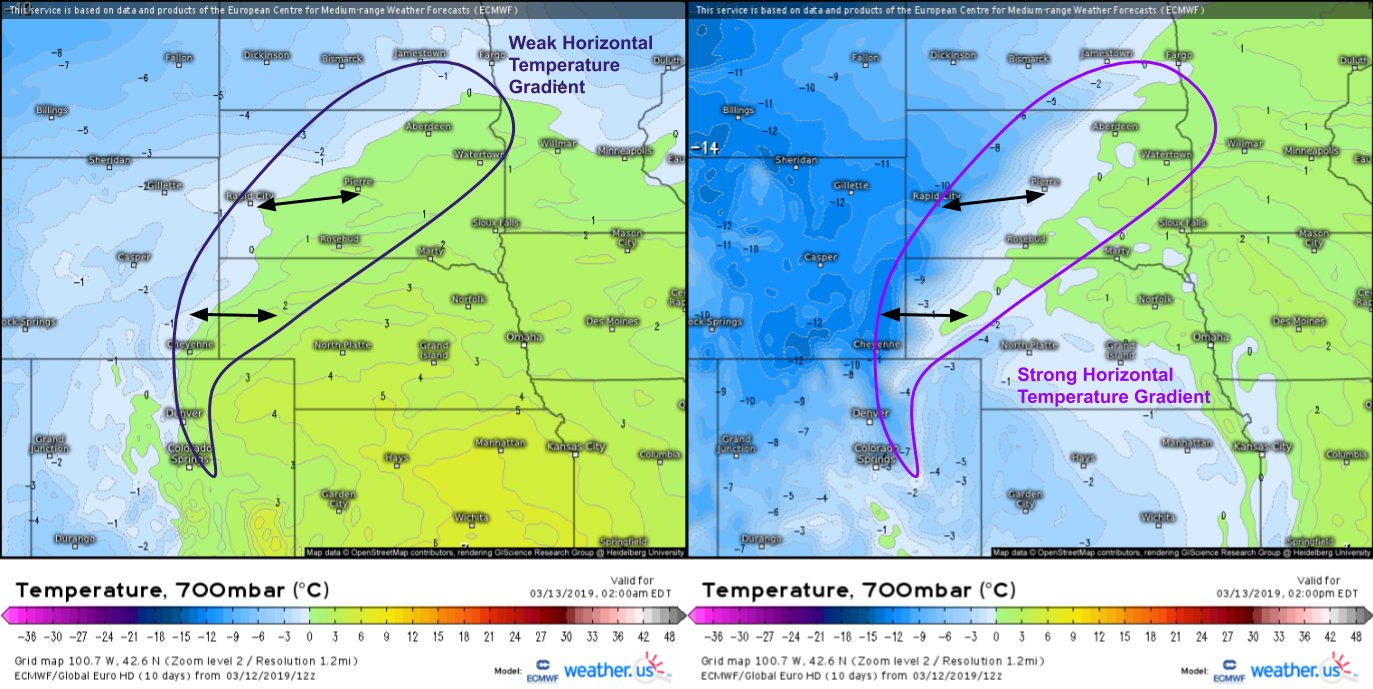
So what is frontogenesis? Simply explained, it’s the creation (genesis) of a boundary between airmasses (front). It can be measured by the increase in the horizontal temperature gradient over a given area over time. An example is shown below.
Low/mid level frontogenesis has the biggest impact on our weather, so that’s where we’ll be focusing here. The map on the right shows the temperature at about 10,000 feet above sea level over the NW Plains at 2 AM on March 13th, 2019 while the map on the left shows the same parameter/area twelve hours later. Notice how the horizontal temperature gradient increases dramatically during this time. At 2 AM, the temperature over SE Wyoming was just three degrees colder than over the Nebraska Panhandle. By 2 PM, there was a 10-12 degree difference over the same area! A similar change can be seen farther south in Denver and farther north in South Dakota. So how does this gradient appear and why do we care about it?
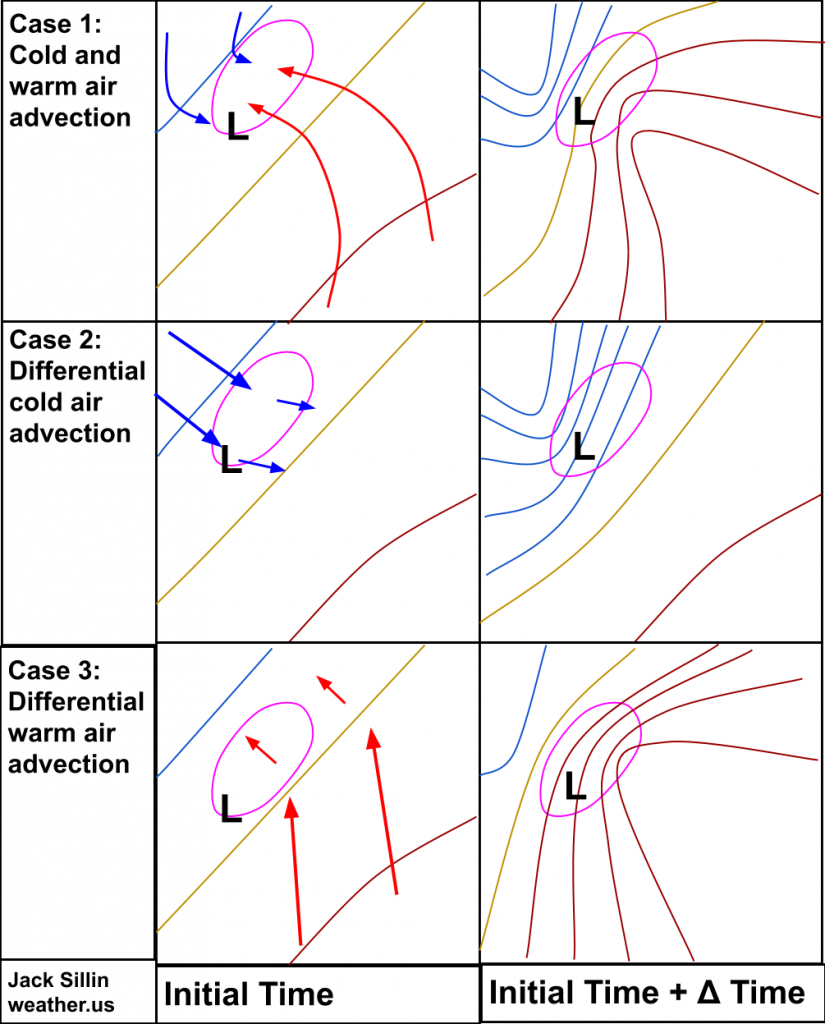 There are three basic categories of setups that produce frontogenesis, each of which is outlined to the right. The ‘L’ represents the approximate location of a low pressure center, the arrows represent advection of air either warm (red) or cold (blue), and the thin lines represent contours of equal temperature either warm (red), cold (blue), or in between (tan). Thicker arrows indicate stronger winds relative to the thinner arrows. The pink circle represents the approximate area where frontogenesis is occurring.
Note that in each case, winds are converging in or near the frontogenesis area. When winds converge in the low/mid levels, air piles up and is thus forced upward. This upward motion is what produces the bands of heavy rain and snow we expect in frontogenesis setups. Note that this process can occur in many setups that don’t look exactly like what I’ve shown here, this is just a sample of three generally possible cases.
So what do the results of frontogenesis look like? The answer will depend on the season, but clouds and precipitation are a good bet. If it’s cold enough, the precipitation will often fall as bands of very heavy snow.
Below is the composite radar loop corresponding to the 700mb temperature maps shown above for 3/13/19. While the rain/snow line isn’t clearly visible, the precipitation falling NW of Aberdeen/Pierre South Dakota and most of what’s W of North Platte Nebraska is snow. That’s the area we’ll be focused on, as that’s where the frontogenesis is occurring. Note that heavy precipitation is also falling farther southeast. You don’t need frontogenesis to get heavy precipitation in the winter, it’s just one of several possible paths towards that outcome.
Note that the area we highlighted as experiencing strong frontogenesis is also experiencing heavy precipitation. That precipitation isn’t falling where the temperature gradient is absolutely strongest, but instead where the gradient is strengthening the fastest over time. That’s why there are some breaks in the precip over the NE panhandle while parts of SD and CO are seeing very heavy snowfall.
Frontogenesis often occurs either to the northwest of the surface low (as shown above, the surface low is the swirl between Denver CO and Hays KS) or to the northeast of the low, as shown below.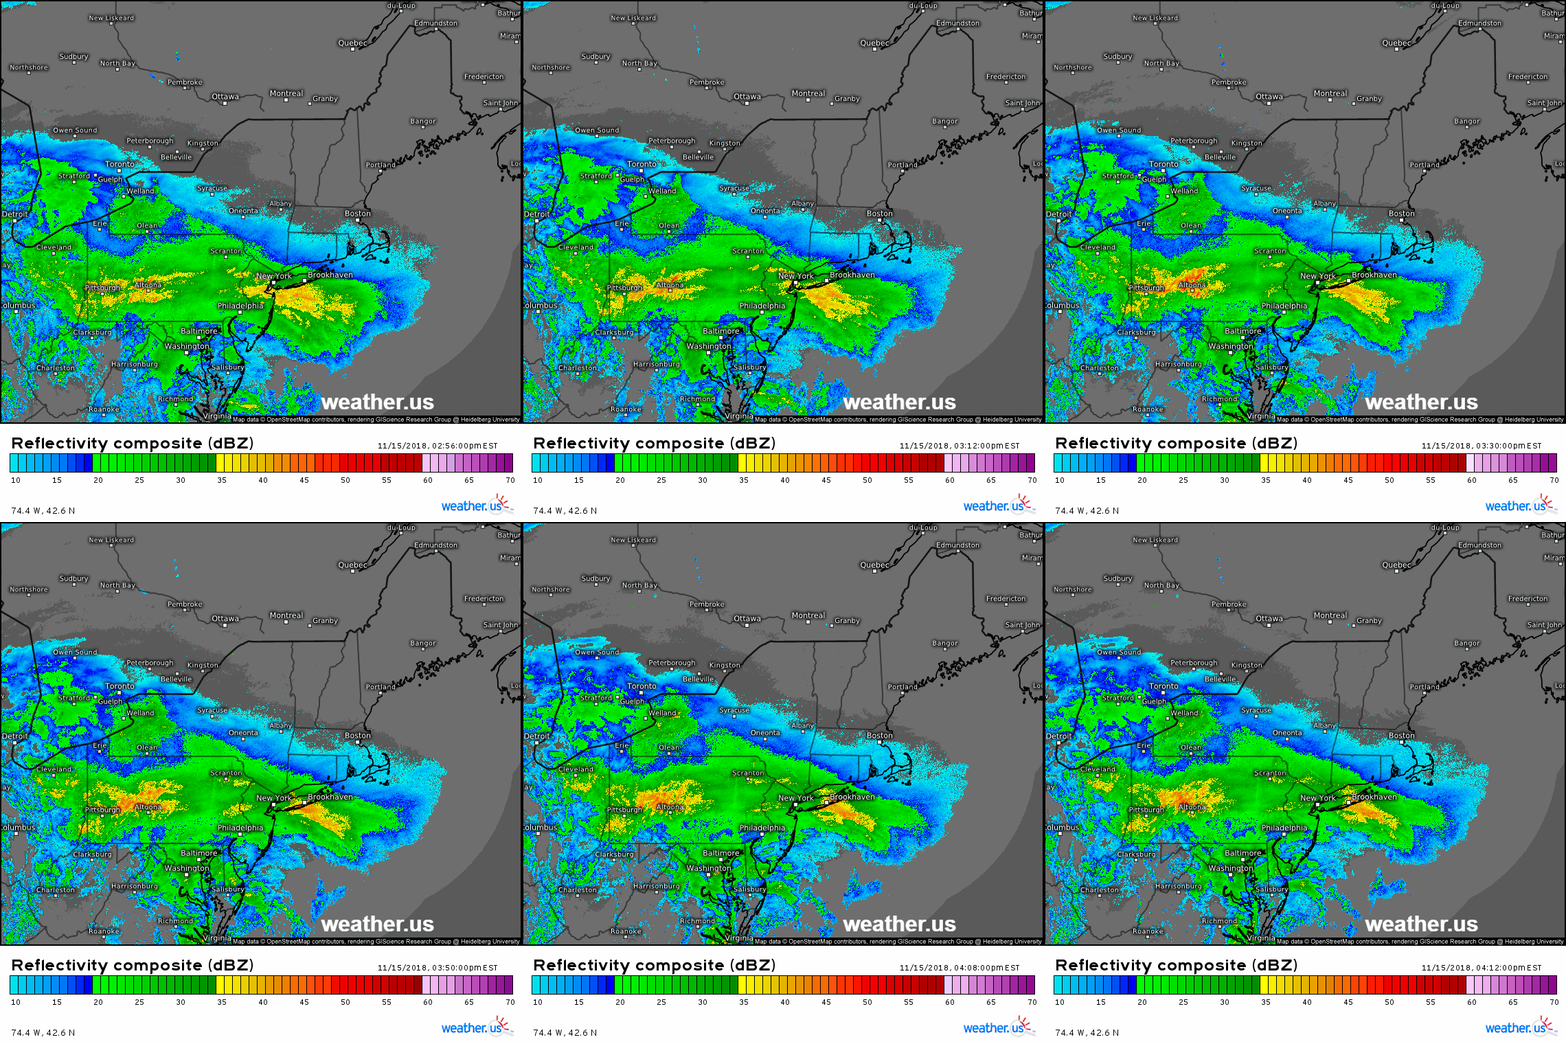
If you happened to be commuting in the NYC area during or just after this radar loop on Thursday November 15th, 2018, you’ll know just how intense frontogenesis bands can get. This case is an example of differential warm air advection, where warm air arrives much faster in the southern part of the frontogenesis area compared to the northern part. The horizontal difference in how fast the warm air is arriving leads to a strengthening temperature gradient (frontogenesis), and its associated convergence/upward motion. These snow bands brought the NYC metro area to a complete standstill as snow fell at rates of 1-2″ per hour right at the start of the PM commute. Figuring out where frontogenesis will occur is important to figuring out where these disruptive snow bands will set up!
While we currently don’t have maps that display the frontogenesis parameter directly, you can spot it by looking at temperature forecasts for a given level over time. If you see a gradient develop and/or strengthen through a 6-12 hour period, that’s a good indication of frontogenesis.
-Jack
