Next Winter Storm To Move From The Southern Plains To The Mid Atlantic This Weekend
Hello everyone!
After a series of storms that have only impacted the top corners of the country, we now have a system set to develop in the Southern Plains and bring a stripe of snow from Colorado all the way to the Mid Atlantic. I’ll dig into this system here, explaining some of the meteorological processes behind the upcoming snow as well as how to use the tools at weathermodels.com and weather.us to visualize the uncertainty associated with the system.
Here’s a look at WV imagery across North America this morning, which highlights a few features that will be key to the upcoming storm system. The upper level disturbance that will actually drive the storm’s development is marching east through Southern California, and can be seen clearly passing through Los Angeles. As that energy arrives over the Southern Plains, it will drive surface low development in the TX/OK panhandle region tomorrow afternoon. The system already is tapping some tropical moisture which can be see streaming north out of the Eastern Pacific Ocean. To the east, a complex area of low pressure can be seen in Maritime Canada. NW flow on the back side of that storm is funneling cold air straight from the Canadian Arctic down into the Mid Atlantic. You can see that stream of cold dry air on the WV imagery beginning on the shores of the Arctic Ocean before travelling SE to Hudson Bay then making a turn due South through the Great Lakes to the Mid Atlantic. The clash between the Pacific moisture associated with that California system and the Arctic air to the east will set up the snow threat this weekend.
With the general setup in mind, let’s dig a little deeper into the dynamics at play with this system.
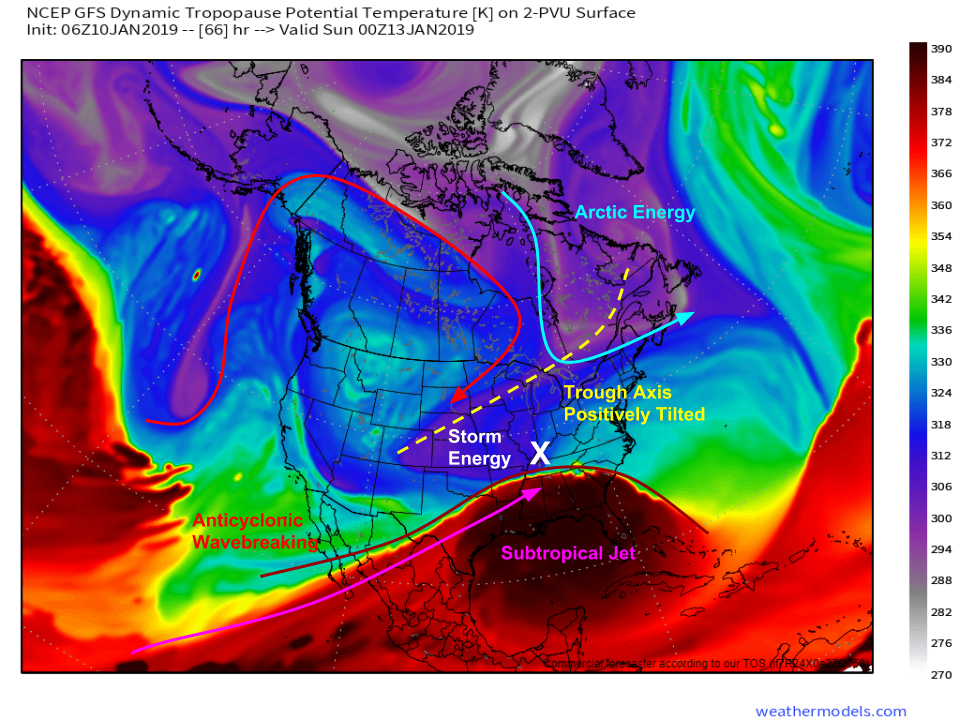
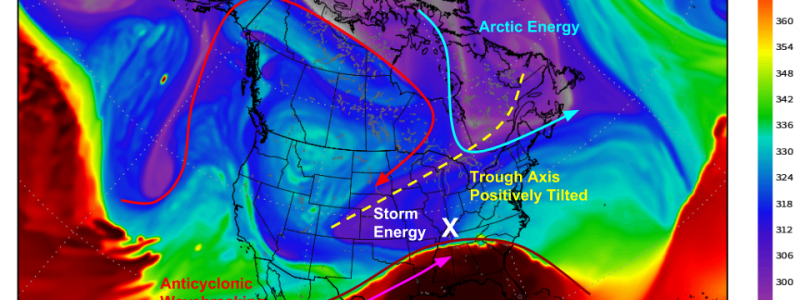
Starting on the large scale, here’s a look at the pattern across North America on Saturday night via weathermodels.com, as the storm is in progress across the Ohio Valley, and just set to get going across the Mid Atlantic. The GFS’s dynamic tropopause maps are a great way to visualize features in the upper atmosphere that don’t always appear as well on other maps. The most important feature that this map highlights is a process known as anticyclonic wavebreaking, which is occurring across the Western part of the US and Canada. Think of AWB as a process similar to the breaking of an ocean wave. Both have a crest and a trough, and the breaking process involves the crest crashing into the trough. In the atmospheric case above, the crest can be seen falling southward over Central Canada, with the trough located in the Central US. The lip of the wave is the important piece of the puzzle for the track and development of the storm system. The southward movement of the wave lip will stretch the storm’s energy out and prevent it from moving very far northward. Thus, we can just about write this one off for NYC, Boston, and points north. Additionally, the wave breaking event will shove Arctic energy digging south through Canada to the east. This means it won’t be able to connect with the storm, which will limit its potential intensity. All that to say, this won’t end up being a particularly intense storm system. However, that doesn’t mean it won’t be impactful!
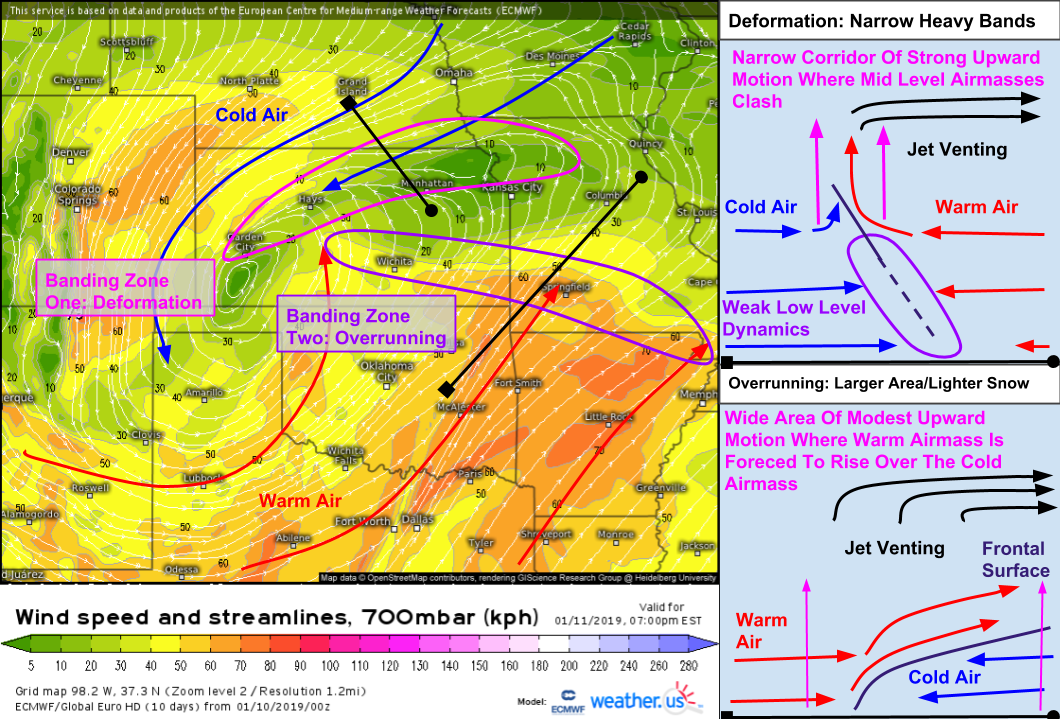
The first phase of the storm will impact parts of the Southern/Central Plains from Eastern Colorado through Kansas and into Missouri tomorrow night. The ECMWF’s mid level wind forecast shows two areas to watch for heavy snow, each driven by different processes. Schematic illustrations of each process are provided to the right of the forecast map, with a little more explanation offered below if you’re curious.
The first process, playing out in Kansas is known as deformation, where warm and cold air are forced together in the mid levels. This creates a narrow zone of rapidly rising air as the two airmasses collide. Deformation bands are typically on the narrower side, but can easily put down several inches of snow per hour. This particular case doesn’t appear to be particularly intense, but watch for some localized higher totals wherever that band does set up.
The other process unfolding tomorrow night will be overrunning. This typically involves a broader area of lighter snow as opposed to a concentrated heavy band, as was the case with deformation. However, over a long period of time, strong overrunning can produce sizable snow totals! In this event, Missouri is the place to watch for persistent overrunning leading to higher snow totals.
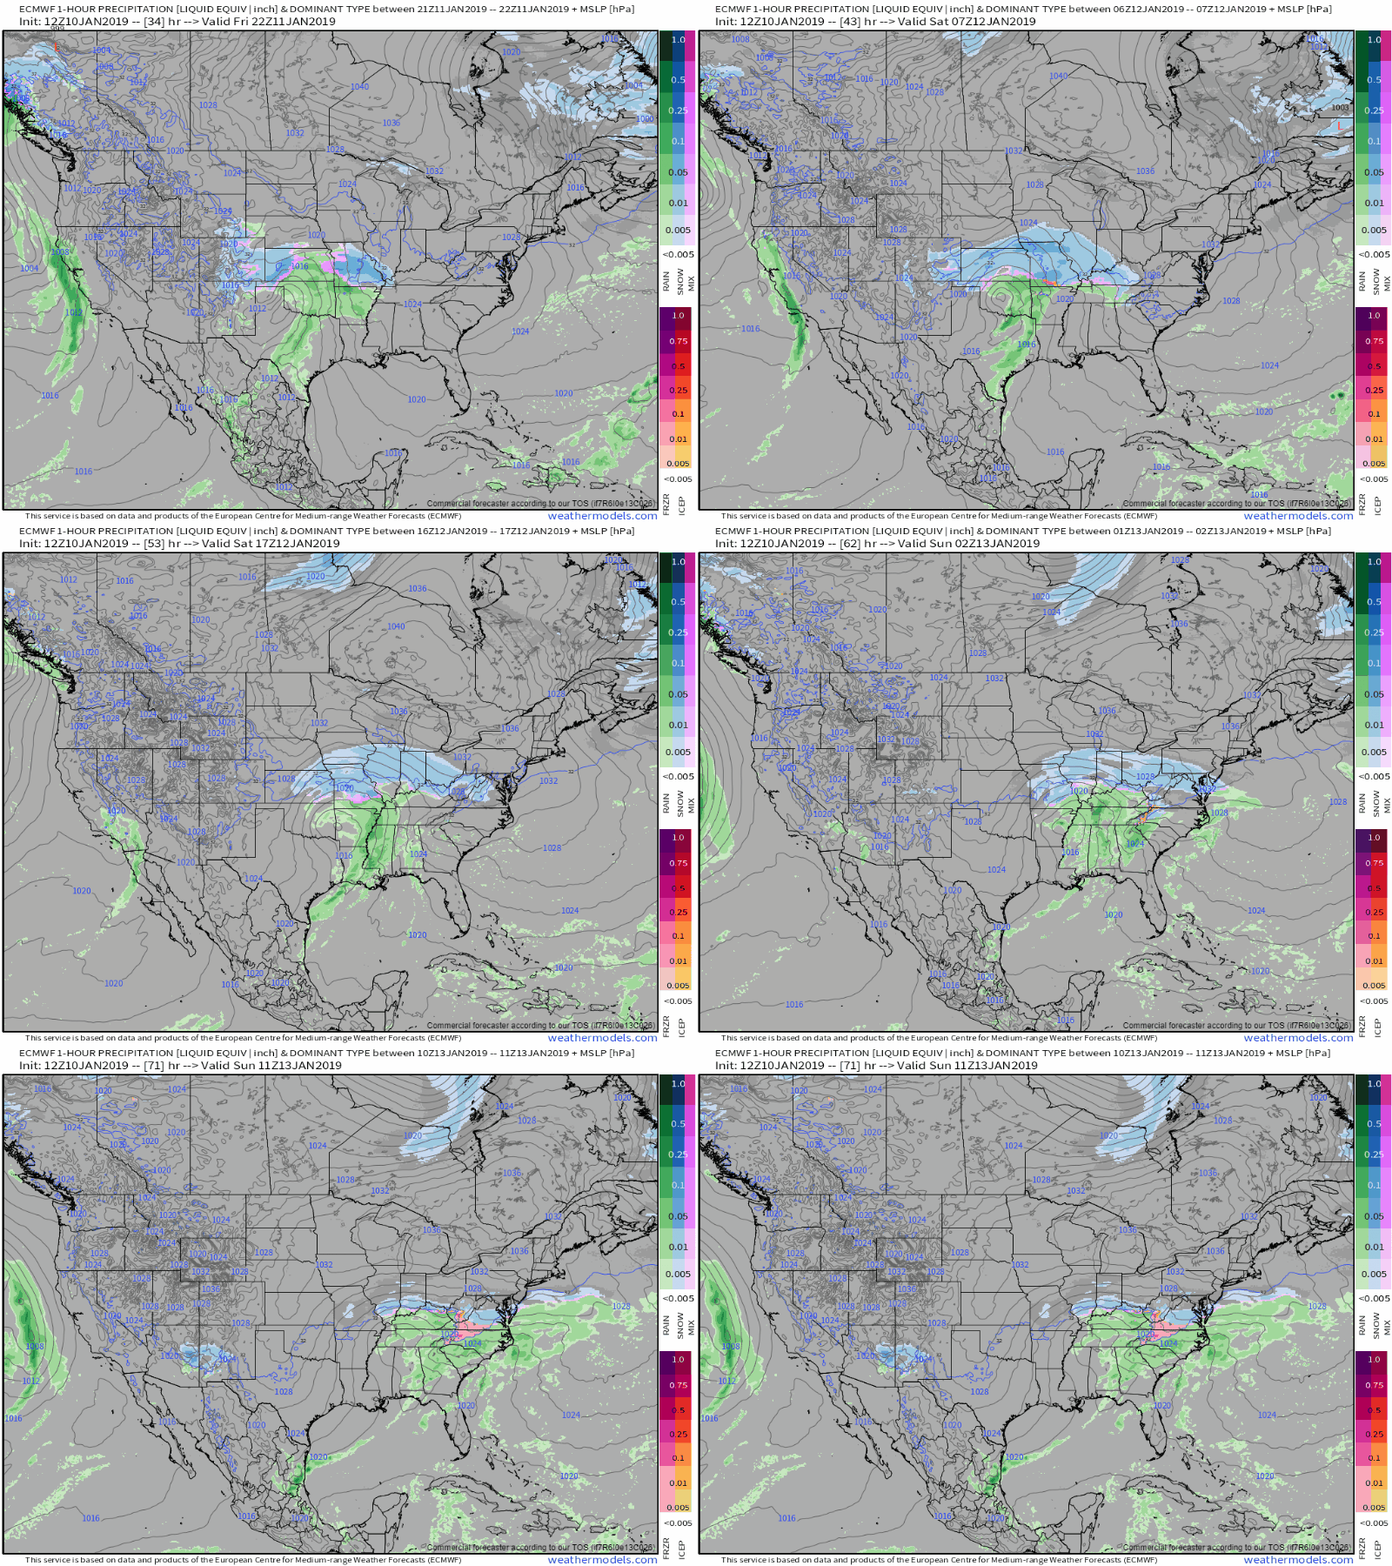
Here’s a quick overview of how the ECMWF expects the storm to play out as it heads east this weekend. Note the deformation banding across Kansas early in the loop, followed by lighter overrunning from Missouri east through the Ohio Valley towards the Mid Atlantic. As cold high pressure sinks south from Hudson Bay (note the 1040mb pressure contour indicating a very strong/cold high pressure system), warm air surging north in the Mid Atlantic will be undercut. The result will be freezing rain across much of western NC and SW VA as snow melts in a layer of warm air aloft before refreezing at the surface. GIF via weathermodels.com.
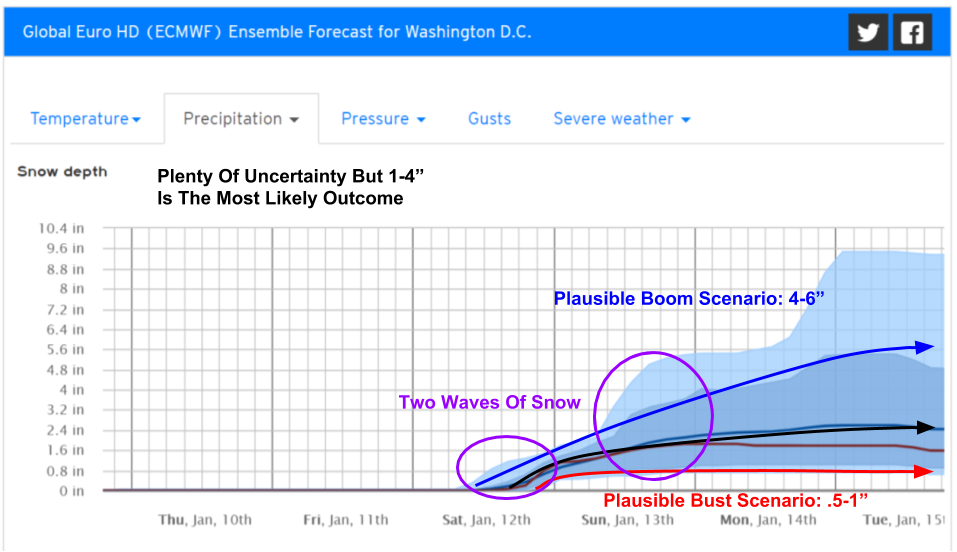
There’s still plenty of uncertainty with this system, especially as you head farther east. Our Forecast Ensemble tool at weather.us is great for understanding forecast uncertainties and the range of possible outcomes present for a given location. The chart above shows the forecast for snow in DC. The top edge of the dark blue marks the “90th percentile” value, that has roughly a 10% chance of being exceeded. This represents a plausible “best case scenario” if you’re rooting for snow. For DC, it’s somewhere in the 4-6″ range. The dark blue line is the ensemble mean, which is theoretically the most likely scenario. The bottom edge of the dark blue area is the 10th percentile, and has a 90% chance of being exceeded. This is the plausible “best case scenario” if you’re rooting against snow. By using ensemble visualizations like this, you can understand not only what is most likely to happen, but also what the range of possible outcomes is. While it may be best to expect 2-3″, it’s a good idea to be prepared in case 4-6″ ended up falling, because that’s well within the realm of possibility!
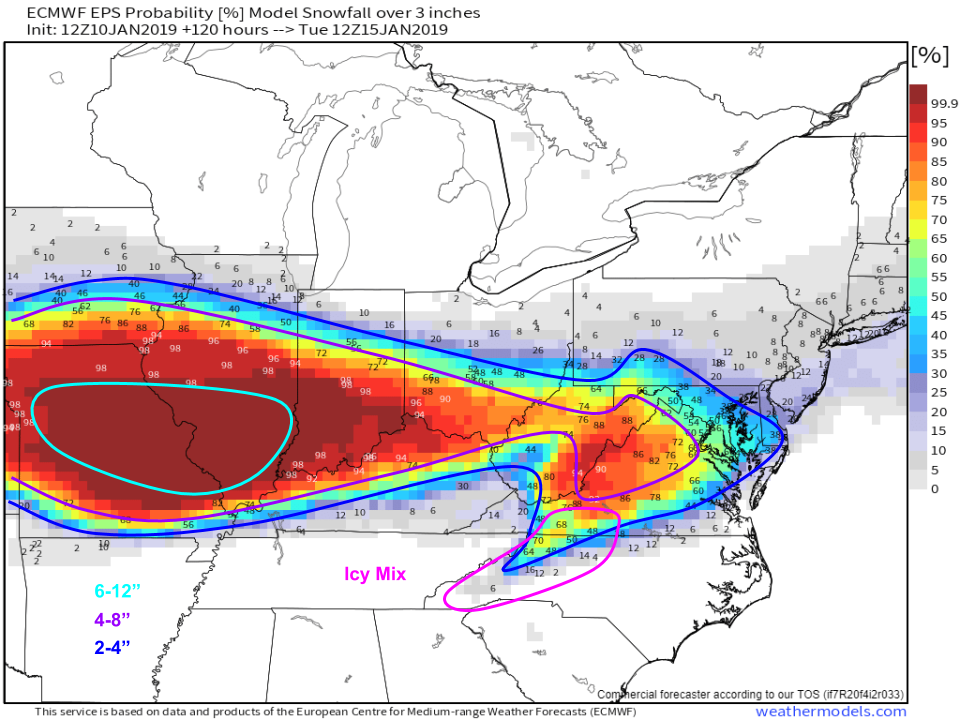
This is another ensemble visualization of forecast snow totals via weathermodels.com, just done in map form instead of graph form. The values on the map indicate the chance that any given point will see more than 3″ of snow. I’ve drawn in some rough forecast lines that represent what might be the most likely outcome at any given location. I also adjusted a bit for sleet and ice that will fall due to warm air aloft across parts of Western NC and SW VA, but that the model counts as snow. While individual model runs can swing wildly from one solution to another, ensembles typically keep a much steadier course which is extremely helpful when trying to plan around inclement weather.
Keep tabs on this storm through the week with the model data available at weather.us and weathermodels.com, as well as our storm tracking products at weather.us including HD radar, GOES-East satellite imagery, and current observations.
-Jack

