What’s Behind Today’s Midwest Severe Weather?
Hello everyone!
With widespread severe thunderstorms forecast across parts of the Midwest today, I figured that it’d be a good time to dig into some of the science behind severe weather. I’ll discuss what’s going on behind the scenes of this severe weather event so that you can better use the tools available at weather.us to get a sense of when and where the next round of storms may strike.
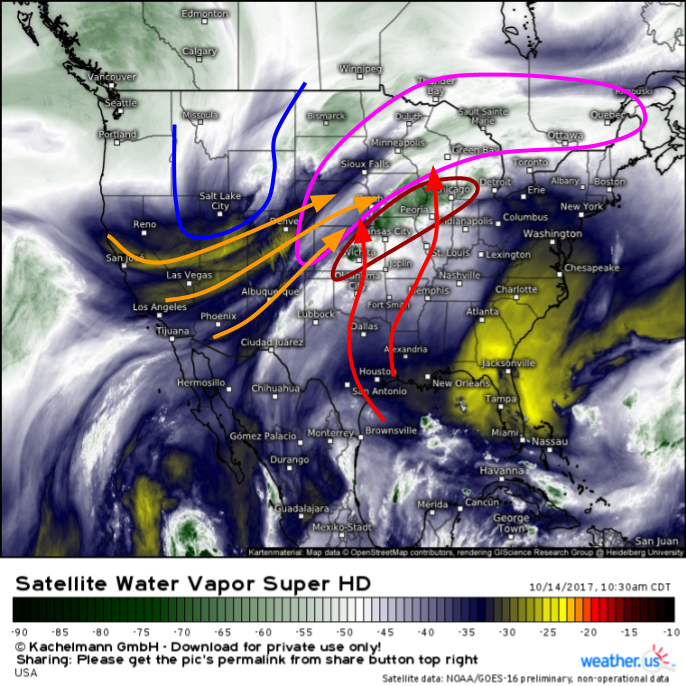
Water vapor satellite imagery (what’s that?) shows the large scale players in this severe weather setup well. An upper level trough (blue line) is located across the Rockies. In general, air rises ahead of upper level troughs, and sinks behind it. Large scale rising air is the first ingredient to look for when forecasting severe weather, because it sets up the background environment favorably for storms. In this case, an upper level jet streak ahead of the trough (pink) is creating large scale upward motion.
You can tell that air is rising by looking at water vapor loops. If an area on the water vapor imagery is gradually turning colder (whiter or greener) with time, you know air in that area is rising. The opposite is also true, and areas of darkening blues/yellows indicate sinking and drying air. Why does this work? Water vapor imagery measures how moisture air contains, relative to how much it theoretically could contain. Warmer air can hold much more moisture than colder air can. This means that as an air parcel rises and cools, it also becomes relatively more moist, even if no water vapor is added to it. On water vapor satellite imagery, air becoming more moist is doing so because it’s rising, while air becoming drier is doing so because it is cooling, and warming.
Let’s dig into the jet streak for a minute, because it is at the root of our severe weather setup today. Without the jet streak, the Midwest would likely be enjoying partly cloudy skies today. At the very least, the severe weather threat would not be nearly as impressive. So what makes the winds at 35,000 feet so important?
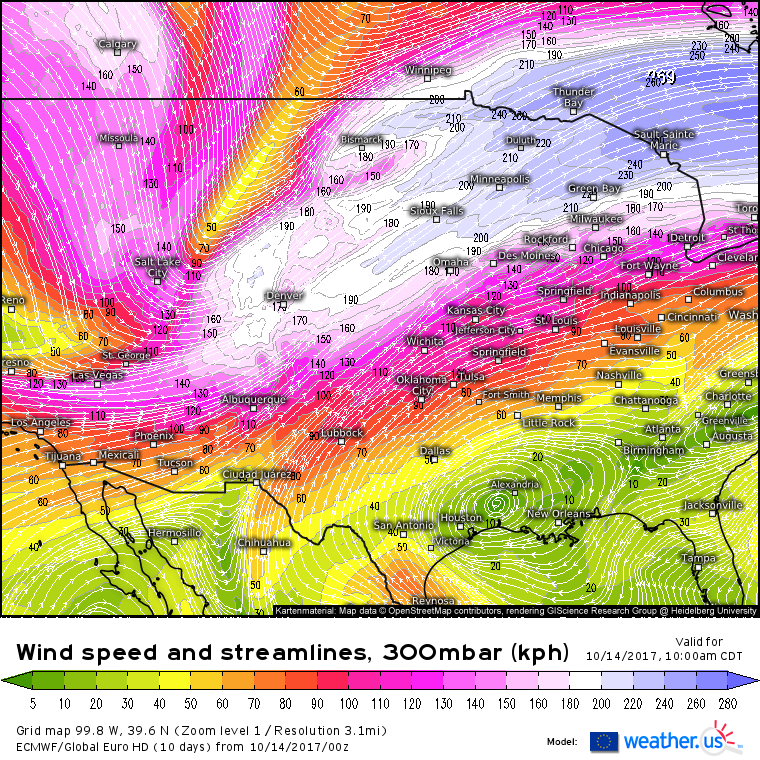
This image is a 300mb (upper level) wind forecast from the ECMWF. Notice the extremely strong winds stretching from the Denver area up into the Northern Great Lakes. This pocket of winds is known as a jet streak, and it is embedded within the much larger current of strong winds known as the jet stream. Jet streaks bring with them a number of wacky dynamics, because they move much more slowly than the air that flows through them. This jet streak has maximum winds in excess of 160 mph, but it’s only moving east at 25-30 mph. As a result, there are intense accelerations and deceleration of air parcels, hence the unusual dynamics. The dynamics that matter most in this case involve the southwestern side of the jet streak, where air is speeding up. This area is known for large scale upward motion, an important factor in severe weather development. Why does air rise in this region? As air parcels accelerate away from each other, a void is created. Air from the lower levels rises to fill this void. In this case, the area we’d look for large scale upward motion due to the upper level jet streak ranges from Michigan back through Iowa and into the Southern Plains.
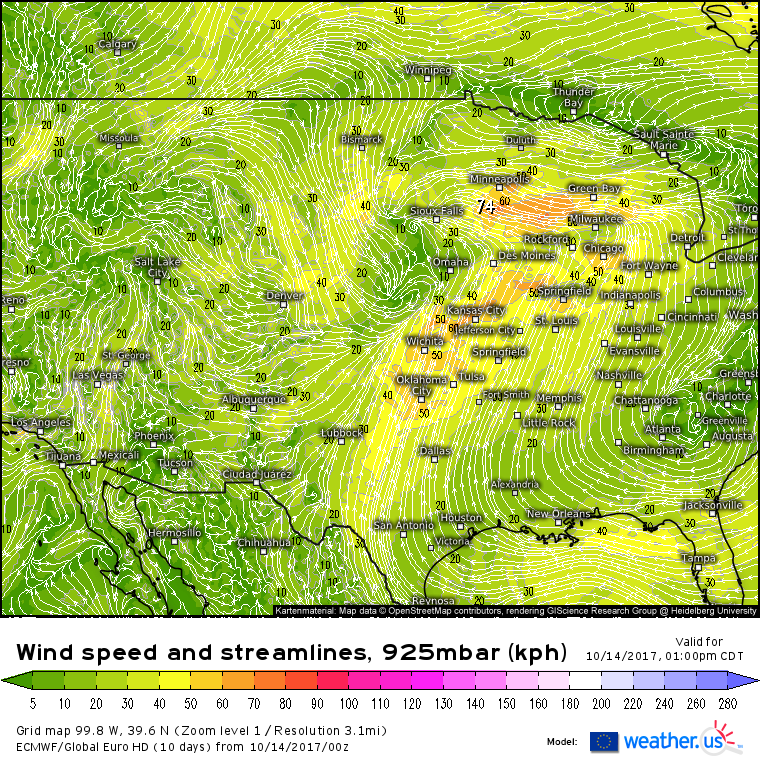
Upper level jet streaks also have repercussions in the lower levels. As air under the entrance region of the jet rises to fill the void left by acceleration, a new void is created in the lower levels. Air must then rush in from different areas to fill the void. The result is a lower level jet. Notice how the strong current of S/SW winds abruptly disappears over Kansas, Missouri, and Iowa, almost directly below the entrance region of the upper level jet streak. When dealing with the southwest part of the jet streak, low level jets are almost always from the south or southwest. This is important for severe weather forecasting because south-southwesterly low level jets transport warm, moist, unstable air northward from the Gulf of Mexico. They also provide strong winds for thunderstorms to tap into. If a LLJ is producing 70 mph winds 2,000 feet above the ground, it won’t take a super strong thunderstorm to transport some of those winds to the surface where they can cause damage.
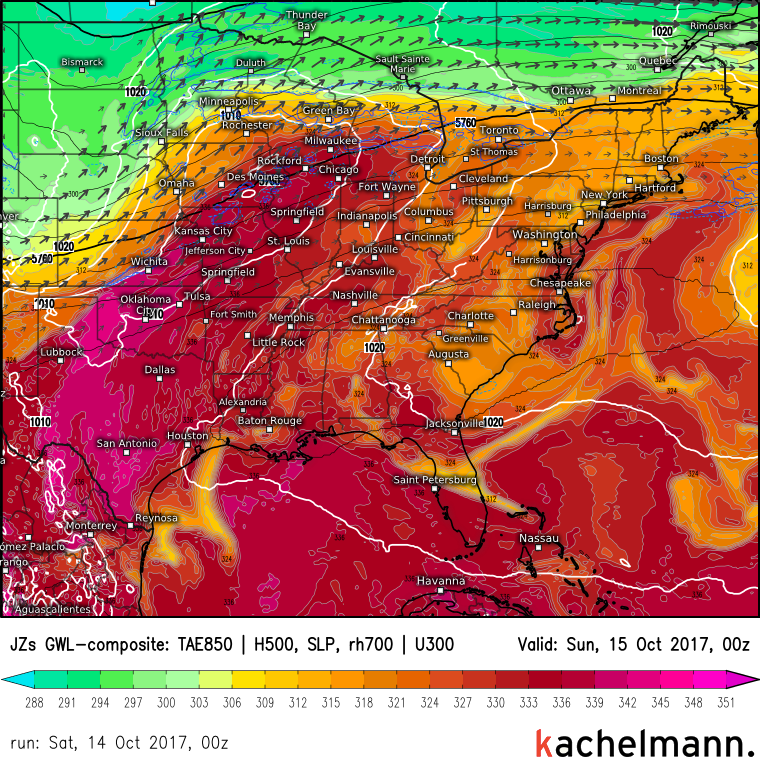
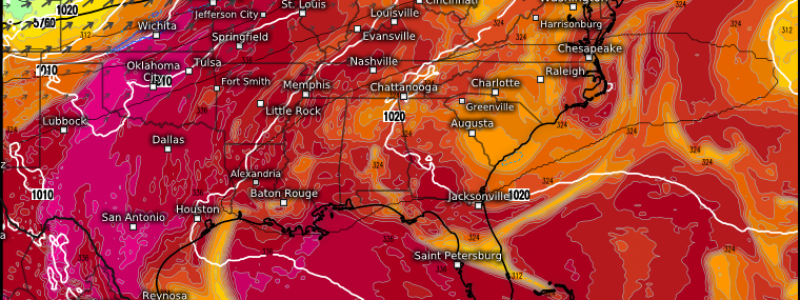
This composite map puts all the pieces together. The vectors (arrows) are 300mb winds. Notice the strong winds (large arrows) beginning in SE Colorado and continuing NE through the northern Great Lakes. The shading is a parameter known as theta-e which is basically a measure of heat and humidity. This shading highlights the stream of warm, humid air rushing northward from the Gulf of Mexico up into the Midwest. This is thunderstorm fuel, transported into an area of rising air by the low level jet which is fueled by the upper level jet streak. Now that we have thunderstorm fuel and general rising motion, we need some sort of focused trigger mechanism to turn gradual rising motion into explosive rising motion. The white lines on the map above show just that- a cold front stretching SW from a developing low pressure center over Iowa. This cold front will provide the strong, focused rising motion needed for thunderstorms to develop. Additionally, a warm front stretches ENE from the low out into the Southern Great Lakes which will provide an additional focus for thunderstorms farther east towards Michigan.
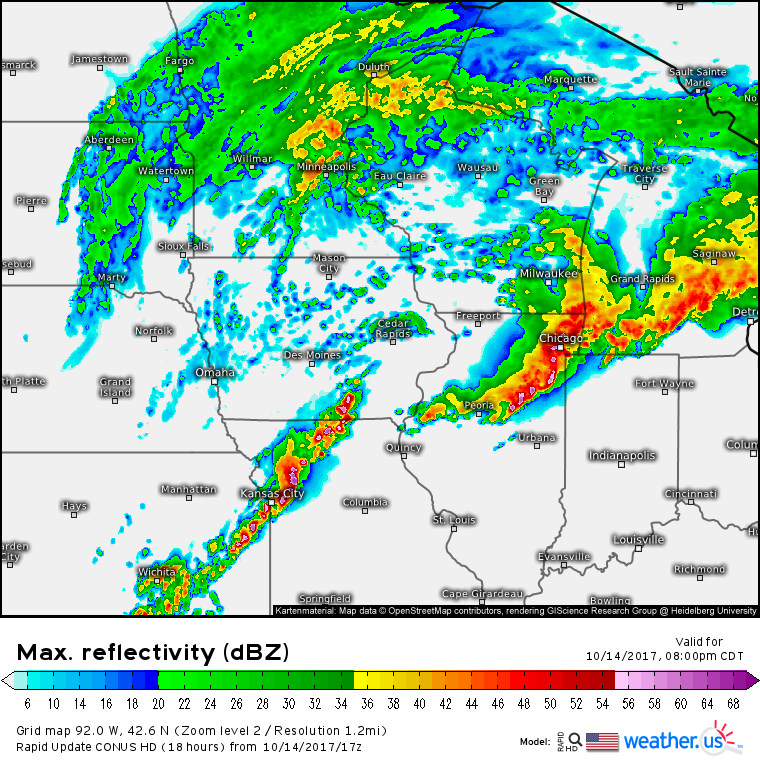
This map shows the results of the jet streak and cold front coming together. It is a future radar simulation from the HRRR model. The actual radar will likely look a bit different 6 hours from when I’m writing this, but the general idea is likely to be quite similar. Storms will be developing both along the warm front, and along the cold front. Even though the storms along the warm front will be tracking over areas that have already seen thunderstorm activity, the strong LLJ will continue to supply warm, unstable air to allow these storms to continue. The storms along the cold front will have no trouble thriving as they move through air destabilized by daytime heating.
Visible satellite imagery is another great tool to see some of the features we’ve been talking about. Visible satellite loops are especially useful because they show the change in position of different features over time. The upper level jet streak is visible here if you look at the upper level cirrus clouds that are racing ENE over the Upper Midwest. The low level jet is visible if you look at the lower level clouds over the Southern Mississippi Valley. These fair weather cumulus clouds are oriented in “streets” parallel to the wind flow. Easterly flow near New Orleans turns southeasterly near Houston before becoming more southwesterly between Tulsa and St Louis. The frontal boundary is where storms are ongoing now. The front ranges from Western Texas, near Lubbock, up towards Wichita and Des Moines. As daytime heating continues, expect even more in the way of storms to develop this afternoon.
You can use all the tools I’ve discussed here to evaluate any future severe weather event. Watch model forecasts for upper level jet streaks, and their accompanying lower level jets. Use water vapor satellite imagery to pick out upper level troughs, and areas of rising/sinking air. Use visible satellite imagery to keep track of features in near real time and to watch storms develop. Finally, once storms do develop, use HD radar imagery to spot storm-scale features such as “backwards C” signatures that indicate damaging winds or “hook” signatures that indicate potential tornadic activity. You can also use our lightning detection tool to keep track of dangerous lightning strikes.
-Jack
