Harvey Rapidly Developing In The Gulf Of Mexico
Good morning everyone!
Harvey has strengthened and organized overnight and is now rapidly gaining steam over the Gulf of Mexico. Hurricane Hunter data suggests that the storm is quite a bit stronger than models realize. While this doesn’t mean we should discount models all together, they’re still valuable tools for anticipating impacts, it does mean we should take them with a grain of salt. This blog post will go over some of the overnight developments in satellite and model data that are now supportive of a stronger Harvey as it moves into Texas tomorrow night.
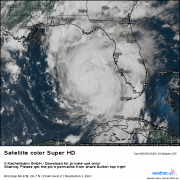
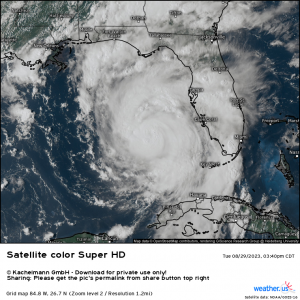
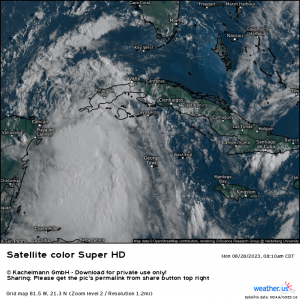
We’ll start where we always do, with GOES-16 high resolution satellite imagery. Click the link to see the animated version of the loop yourself. Once there, you can click the map to zoom in/around and you can also use the menus to the left of the image to adjust the type of satellite imagery you’re looking at.
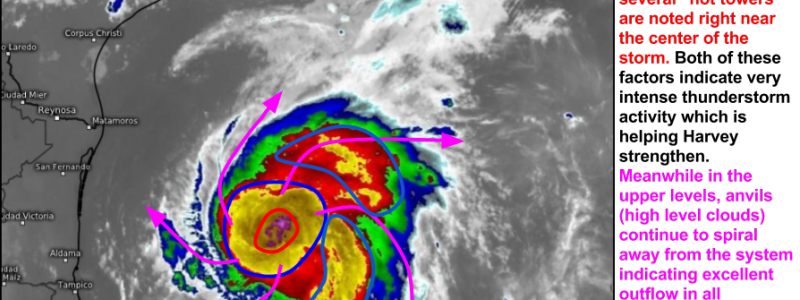
Satellite imagery shows a strong and strengthening Harvey. Intense thunderstorm activity is noted all around the center with particularly intense “hot towers” rotating right around the immediate center. This intense thunderstorm activity will power more intensification of the system today as it moves northwest. In the upper levels, cirrus clouds continue to fan out away from the center. This tells us that an upper level high pressure system is located overtop the system. Why is that important?
An upper level high pressure system (anti-cyclone) helps to vent the air from the top of the system out away so that it can sink away from the center of the storm. Remember that sinking air suppresses thunderstorm development; if air rapidly rising in the center of the storm had nowhere to go but straight back down, the tropical system wouldn’t have long to live. With an upper level anticyclone venting the system, air can continue to rapidly rise in the center of the storm, where it can be quickly whisked away when it reaches the stratosphere. The presence of an upper level anticyclone over Harvey is confirmed by seeing clockwise rotation of the high level clouds on satellite loops. Remember that in high pressure systems, air rotates clockwise while the opposite is true for low pressure systems.
Another important thing to note is how much stronger the storm is compared to model forecasts.
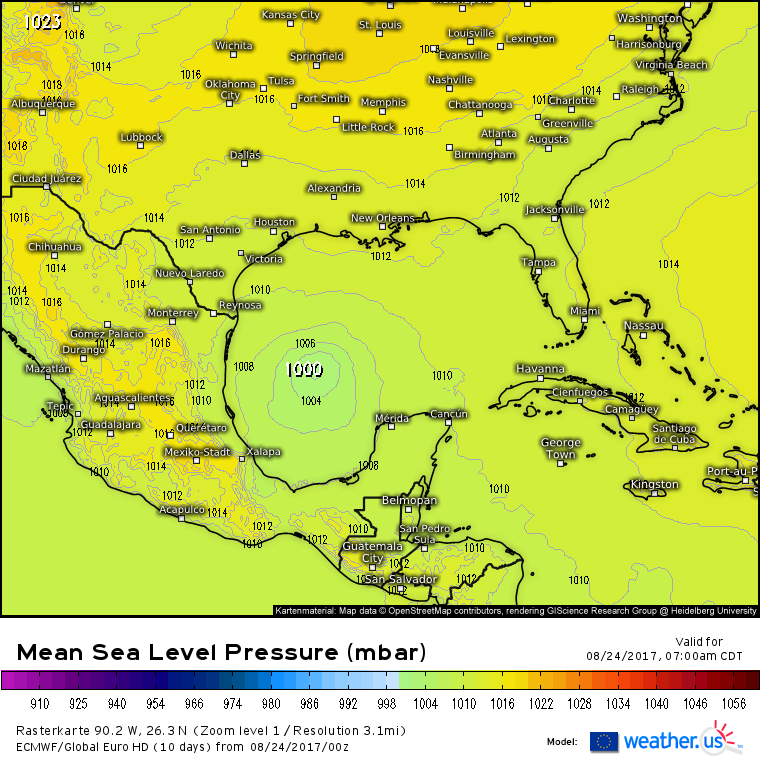
This is the ECMWF’s forecast for 7 AM CDT today. It’s showing a minimum central pressure of 1000mb. Hurricane Hunter data from earlier this morning found a minimum central pressure of 996mb. It takes the ECMWF nearly 24 hours to get the system down to this pressure. What’s the bottom line? The storm is stronger than expected. Instead of expecting a strong Tropical Storm upon landfall, residents of the Texas coast should prepare for a full blown hurricane, and potentially a fairly strong one at that.
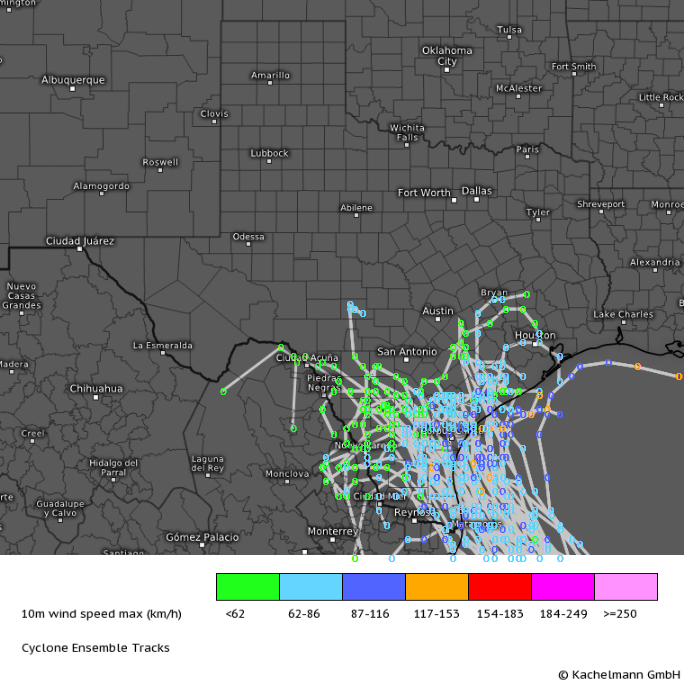
Model guidance is coming into a little better agreement with regards to the track of the system. Landfall looks to be along the Texas coast near Corpus Christi. Harvey may take a track parallel, and close to, the coast before it makes landfall which would increase the threat for hurricane force winds along the coast near Brownsville, even if the storm’s center makes landfall a hundred miles north of those locations.
I’ve linked to plenty of ECMWF data here, because it’s generally the most accurate model. However, it’s not the only model we offer on weather.us! If you click any of the model links above, you’ll get a map with several blue buttons at the top. Click on these buttons to toggle back and forth between different models to compare their forecasts for the storm. Doing this will help you get a more complete sense of the range of possible outcomes for Harvey. Do use caution though, some of the models (such as the CONUS HD) are known for handling tropical cyclones poorly. Don’t take any crazy forecasts from these models too literally.
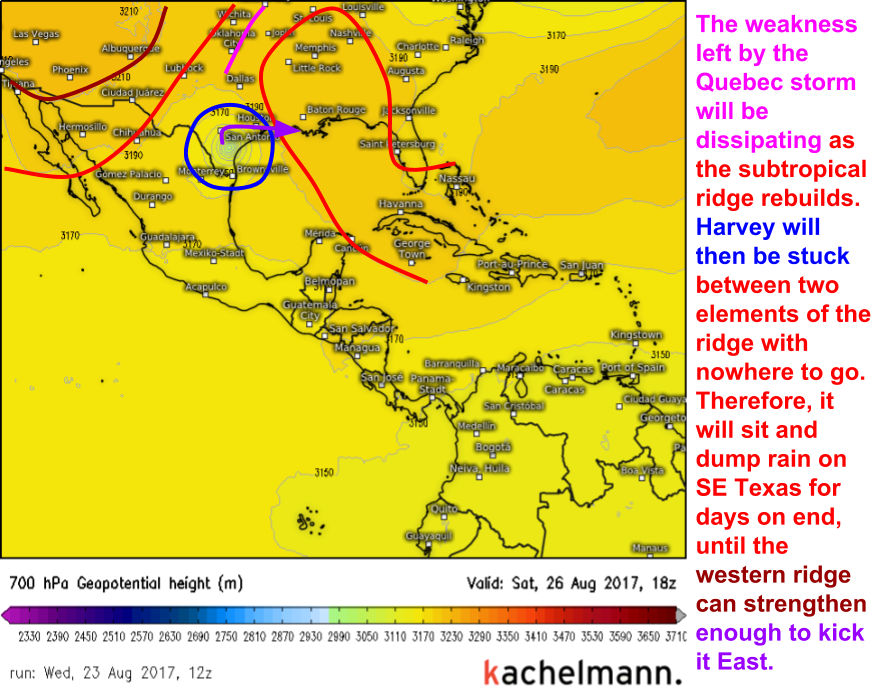
While winds will be an important part of Harvey’s impacts, the real threat will be the flooding. Harvey will stall over Southeast Texas for several days as it sits in limbo between two upper level high pressure systems.
Here’s one of the graphics I used in yesterday’s blog post to illustrate how this works. Basically, each ridge of high pressure is like a brick wall- the storm can’t go through one, unless it’s being shoved out of the way by an even stronger ridge. On Saturday, the storm will make landfall and will be trapped between two ridges of equal strength, one over the Desert Southwest, and one over Louisiana. The storm will then stall out, as it has nowhere to go. It won’t be until the western ridge finally strengthens on Monday that it will be able to shove Harvey east, away from Texas.
Tropical storms and hurricanes are notoriously good rainfall producers. With intense upward motion and deep tropical moisture, they are the perfect recipe for torrential downpours. When a storm moves swiftly through a region, it can bring beneficial rains to often-dry climates. When a storm like Harvey stalls out and drops torrential rains on the same locations for days on end, massive flooding can ensue.
The ECMWF total rainfall forecast looks very similar to yesterday’s. The area from Corpus Christi up through San Antonio/Austin and over towards Houston will be ground zero for this flooding event. Remember that not all flooding with tropical systems comes from the ocean. Areas hundreds of miles inland could see up to two feet of rain, more than enough to cause extensive flooding. The rain will begin tomorrow as the storm nears the coast, and won’t let up until the ridge can kick it east on Monday. The time to prepare for widespread flooding in these areas is today! Don’t wait until the rain starts tomorrow!
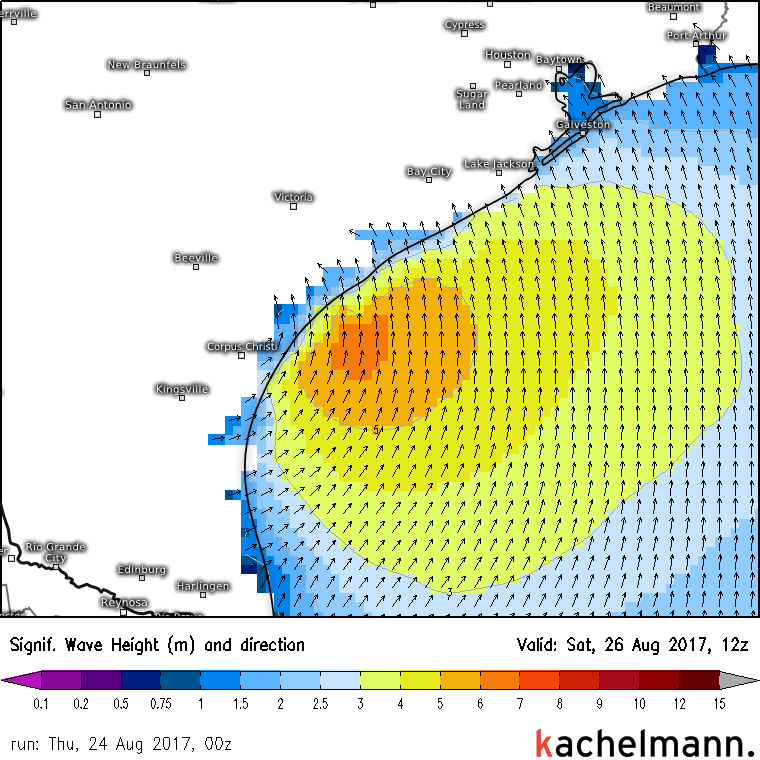
While inland freshwater flooding will make headlines as the biggest threat, coastal saltwater impacts won’t be negligible. The ECMWF wave model is forecasting wave heights up to 6 meters (20 feet) just off the Texas coast on Saturday morning. These waves, combined with the storm surge generated by hurricane force winds pushing water towards land, will cause significant issues along the Texas coast near and just northeast of Corpus Christi. The storm surge will be most significant to the north of where the storm makes landfall as that’s where winds will be blowing water towards the shore. The storm surge will peak Friday night into Saturday morning, but will continue to be an issue through the weekend as the storm sits over Southeast Texas and continues to pull air in from the Gulf of Mexico. As the storm moves east on Monday, winds will turn offshore and waters will subside along the coast.
I’ll have another update this evening breaking down all the latest model guidance, including the 12Z ECMWF, as well as discussing satellite trends for the system. In the meantime, you can track the storm yourself using our tools at weather.us!
Here’s the ECMWF’s forecast for the pressure of the system as it moves ashore near Corpus Christi. You can use the menus to the left of the image to select different parameters (such as wind speed, or accumulated rainfall). You can click the map to zoom in/around, and the blue buttons at the top of the image are where you can toggle back and forth between different models to compare their forecasts.
The sun will soon rise over Harvey, at which point we can use GOES-16 visible satellite imagery to track the storm. Until then, however, we’ll need a view that doesn’t require the sun’s light to create its image. IR satellite works well for this. It uses infrared radiation to measure how warm or cold things are in the atmosphere. The colder the top of a cloud, the higher it is in the atmosphere, and the stronger the storm producing it is. Harvey’s cloud top temperatures below -80C are indicative of very strong thunderstorms! As with the model maps, you can use the menus to the left of the image to select your preferred view, and can click the map to zoom in/around Harvey.
-Jack

