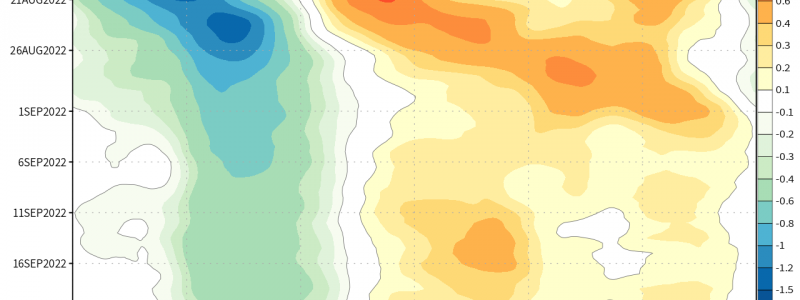
Velocity Potential: Subseasonal Forecasting Using a Hovmoller Diagram
While we’re in the “heart” of hurricane season and approaching a climatologically favorable period for the Atlantic (peak isn’t until early September!), I wanted to take the time to explain a popular diagram that I’m sure you’ve seen somewhere on social media (Twitter); and an overall extremely useful medium to long-range forecasting concept that forecasters like to use during Hurricane season.
First, allow me to explain the concept of velocity potential. This abstract helps to explain two components to wind flow: rotational (air spinning either cyclonically or anticyclonically) and non-rotational (formally we call this “irrotational), where you have air that is rising for example, but isn’t rotating. Think of this example like a pot of water. Once the water reaches the boiling point and if there is a bit too much water, we see intense bubbling and eventually it leaks on all sides laterally. We use this concept to track convection and outgoing long-wave radiation (i.e. clouds in the upper levels of the atmosphere deflect incoming solar radiation, and we can use this to track areas of upper-level divergence using velocity potential!) in the tropics because at the equator, the Coriolis force is nearly non-existent. The Coriolis force is weakest at the equator due to the Earth spinning extremely slow relative to the poles (Coriolis doesn’t cause wind acceleration; it changes the direction of wind and is proportional and equal in magnitude to how fast the wind is blowing, causing it to deflect to either left or right), and we need spin for hurricanes to even exist (any cyclone for that matter). So as a result, we want to identify these areas of where deep convection may exist. Since this parameter is calculated at 200mb (38,662 ft from the surface approximately in a standard atmosphere), we want to see if we have two critical processes happening: Upper-level DIVERGENCE or Upper-level CONVERGENCE.
This idea of mass conservation is one of the fundamental concepts in why and how the atmosphere behaves in the way that it does. Air that converges at the surface will rise and eventually approach the tropopause – An inherent stable level on top of the troposhere that is synonymous with a “CAP, or LID”. Once air approaches this layer, it can’t continue to rise unless forced aggressively from below (theoretically parcels can rise to an extent in this layer, but there must be very intense convection where parcels overshoot this layer, but quickly will then sink back down). Since mass was allocated to the top, air MUST fill that “void” at the surface and this results in a “rushing” of air that converges. This convergence of air from the surface, after rising vertically, spreads laterally outwards once it approaches the tropopause. This is Upper-level Divergence. On the flip side, upper-level convergence is where air converges at the tropopause, then sinks toward the surface warming adiabatically and ultimately creating surface high pressure (subsidence).
Why is this pertinent to hurricane forecasting? Because this is where the term Subseasonal forecasting comes into play! At lead times of 2-3 weeks, we use effective tools such as the Hovmoller Diagram of Velocity Potential to identify these cells of divergence and convergence in the form of Convectively Coupled Kelvin Waves (“CCKW’s”) and the MJO. These large impulses span thousands of miles, creating divergence and convergence as they propagate around the Equator. These tropical planetary systems influence tropical development as research has shown; whether that inhibits tropical development or accentuates it.
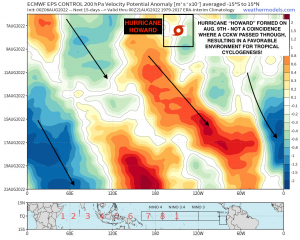
Now, diving into the Hovmoller diagram itself and a great example I was able to construct together that shows how effective they are when it comes to forecasting, especially beyond the capability of numerical weather models. It’s pretty simple in interpreting this diagram. On the y-axis (left hand side) are dates in chronological order spaced out in intervals of weeks. The x-axis is just longitude. The legend on the side corresponds to standardized normalization of the intensity of upper-level divergence and upper-level convergence.
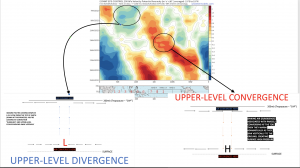
Blue represents DIVERGENCE.
Orange represents CONVERGENCE.
This hovmoller identifies, using the 200mb level (again, that’s where velocity potential is calculated), where there may be CCKW’s, Equatorial Rossby Waves, standing areas of divergence/convergence, and the MJO convective envelope that track across the Equator. Verbatim this diagram shows where these modeled cells track (from Left to Right denoted by the arrows). On the bottom also shows the entire tropics labeled in 8 phases, corresponding to the notorious MJO phases. You use the idea of these areas of divergence/convergence with the tropics view on the bottom to see where exactly these tropical cells (i.e. CCKW’s) will track or will be placed at a general timeframe. Now that we have a basic understanding, lets apply it to forecasting and how it’s utilized!
This specific ECMWF EPS Velocity Potential diagram was issued from August 6th. Hurricane Howard, officially declared as a hurricane on August 8th making it the 7th hurricane of the East Pacific hurricane season, happened to have formed on the verge between the orange and blue shading (upper-level convergence and divergence, respectively). That blue area happened to be a propagating CCKW. Research reveals that these planetary-scale impulses influences tropical development because they can render enhanced low-level spin, increase the environmental humidity and moisture profile, and reduce vertical wind shear. This is usually seen either AHEAD or BEHIND these impulses. Typically, you don’t necessarily want to have the bullseye overhead a tropical cyclone because this may imply strong upper-level divergence for example, which can actually allow for strong vertical wind shear (hurricanes don’t do well with strong shear). It’s not a coincidence that this cell passed through the Eastern Pacific, and Hurricane Howard formed! The orange means enhanced upper-level convergence, which results in stability and sinking air that ultimately stymies convection.
.
To further help elaborate on this topic, I complied two different graphs to show what each subjective colored-shading implies. I’ll attach the link below to this graph so that it’s clarified well since I’ve annotated below.
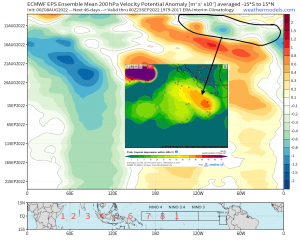
Now using the ECMWF forecasted probabilities of a tropical depression Parameter overlaid with the Hovmoller Diagram from August 8th; we can use this entire concept to help explain why and where there’s a very good chance of tropical development. It just so happened that back on August 10th, there was a very high probability of a tropical development to form by the weekend out in the East Pacific southwest of Mexico, and we can see why! Favorable conditions inferred by upper-level divergence spurred by what likely was a passing CCKW.
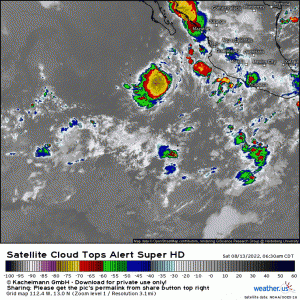
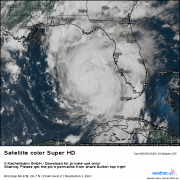
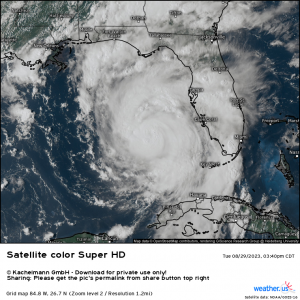
Now on the morning of August 13th, several days later after analyzing this specific diagram earlier this week, we now have a very high chance of a tropical depression to form within the next 12-24 hours. Taking a look below at clout top temperatures, notice how there is an organization of relatively deep convection, indicative of an auspicious environment for further development. However, vertical wind shear is expected to pick up and convective inhibition appears likely. Using the diagram from above however, proves just how useful this method of forecasting is when it comes to hurricane season!
This is the “art” of Subseasonal forecasting and using what we know about how the MJO or CCWK’s influence largely, the background state of the tropics! It’s not exactly a perfect linear correlation, because as I like to emphasize – the atmosphere is chaotic; however, it gives forecasters an edge in trying to decipher if maybe a certain region like the Main Development Region may see enhancement for a period that could already be climatologically primed. It can also help to explain periods where activity is relatively quiet.
So if you ever are interested in maybe how a certain period like the peak of hurricane season coming up in a few weeks could be bolstered, check out a hovmoller diagram of velocity potential. It’ll help garner a sense if we could see an uptick in activity (which we will most likely at the end of the month!). Hopefully this helped!
