Tools For the Upcoming Hurricane Season
The calendar says May but as we edge toward June and the official start of the Atlantic Basin hurricane season, some may have tropical cyclones on their minds.
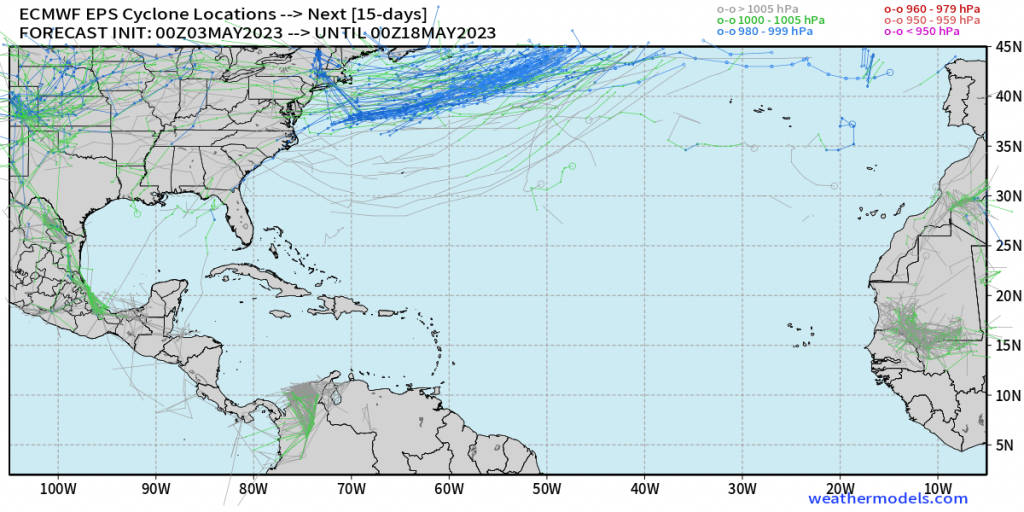
There are currently no real hints of tropical mischief at the moment. However, now, before any storms do actually form, is a good time to make sure you’re prepared if your location is vulnerable.
Beyond that, if you enjoy tracking hurricanes, it’s also a good time to get your “toolbox” in order. This post is for you! Today we’re going to look at the lesser-known tools available at both weather.us and weathermodels.com that can help you in tracking or predicting hurricanes in the upcoming season.
- Sea Surface Temperatures
Weathermodels Link (available in the Model Lab)
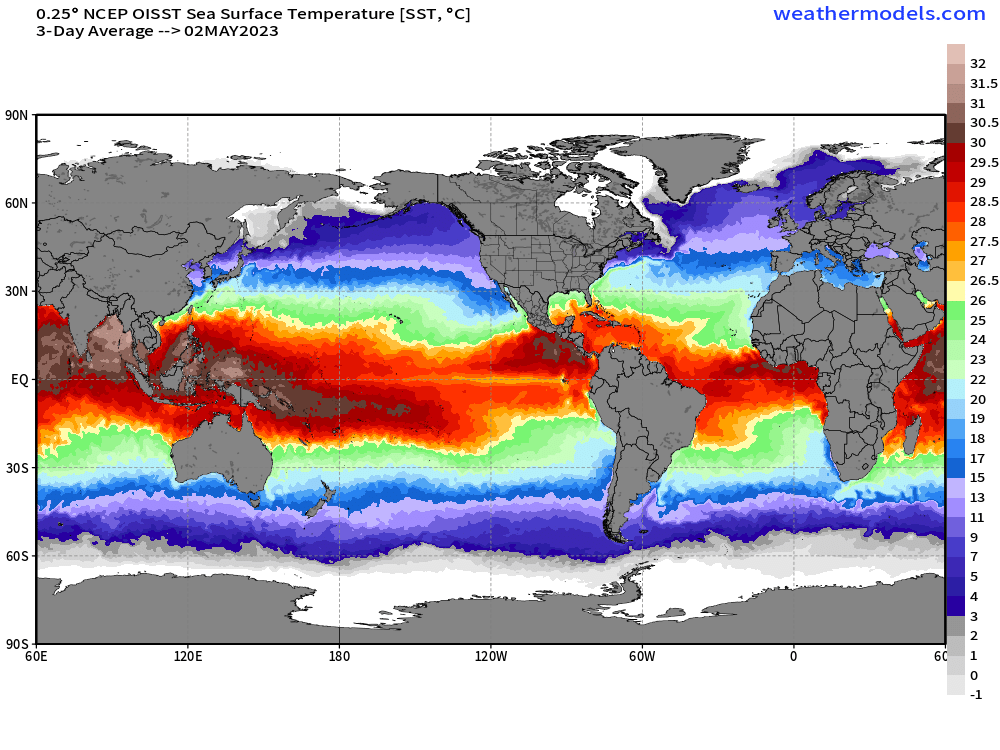
Hurricanes need warm water to form and thrive. Generally, they require water at or above 80 degrees. Want to know where that 80 degree line is? We have a map for that! The Weathermodels map, available in the model lab, can display the water temperature forecast for the entire globe at once or be zoomed in on the basin of your choice. Choose from parameters like 3 Day Average, 7 Day Average, Snapshot, or Anomaly temperature.
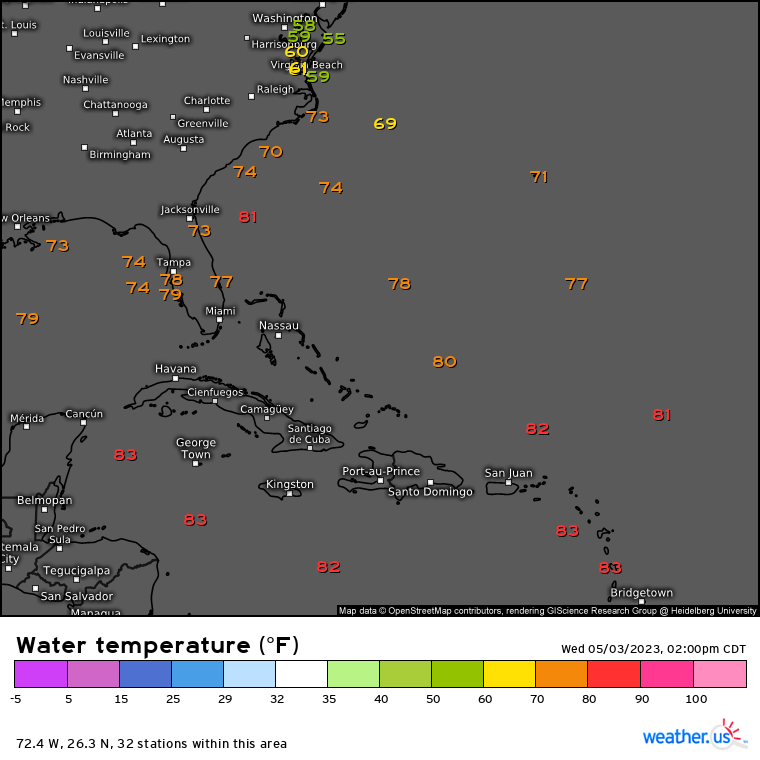
If you’re looking for real-time water temperatures updated often, check out the observations section of weather.us. These stations are updated hourly so you can have an accurate look at the thermal profile of the water. Most stations are closer to land, however, there are a few “deep water” stations as well.
- Wind Shear
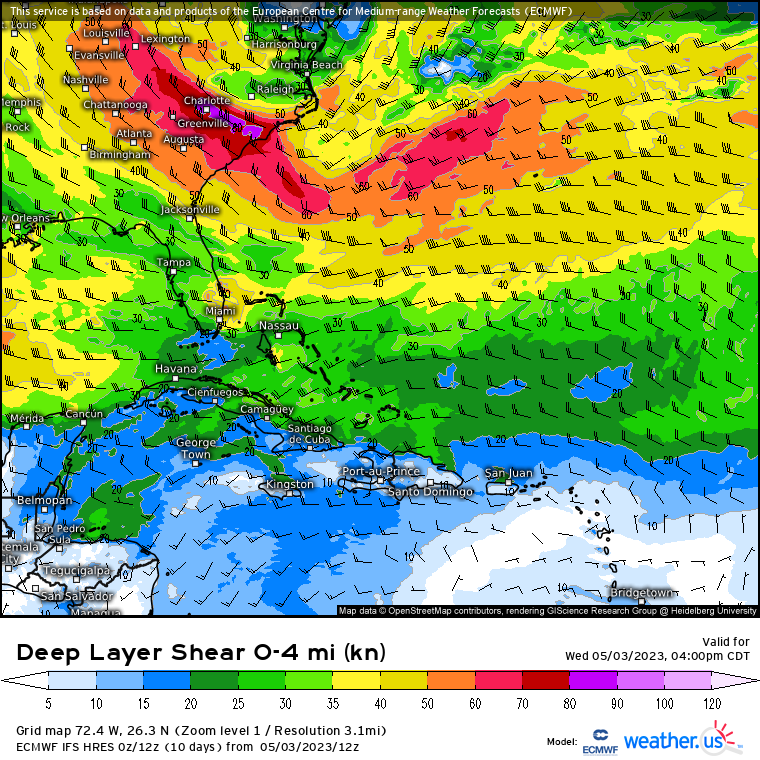
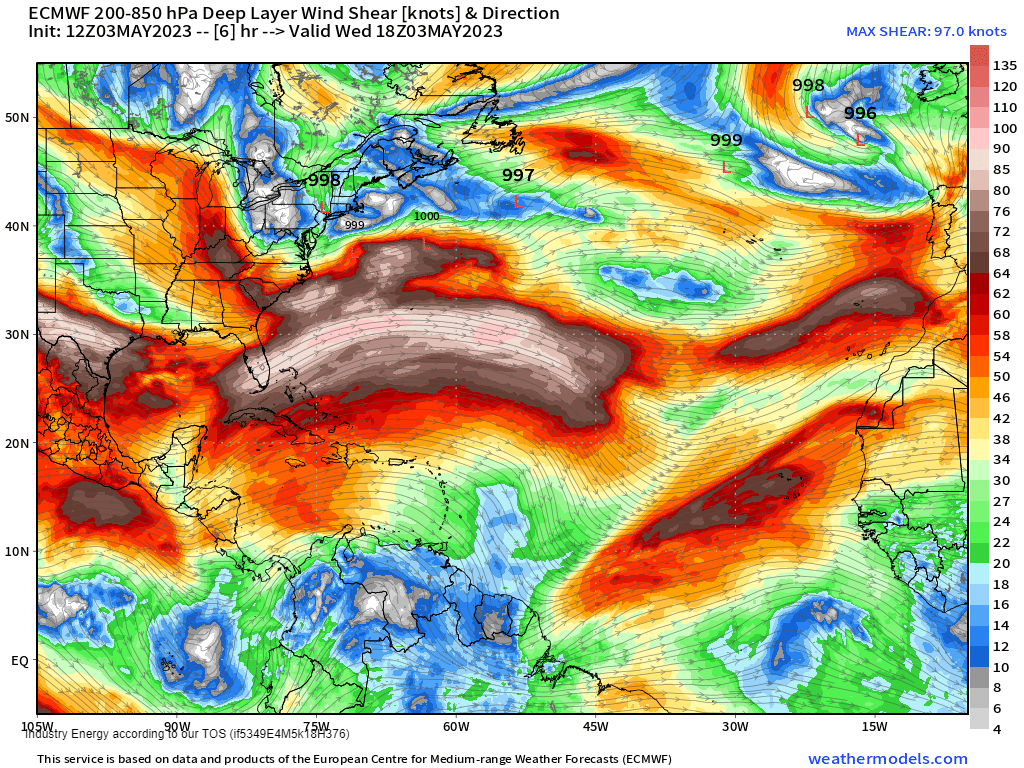
Weather.us Link Weathermodels Link
Hurricanes require little to no wind shear present in order for them to be able to organize and strengthen. Heavy shear can tilt the hurricane’s structure, destroying its circulation. Are conditions favorable downstream for intensification? Check out the Deep Layer Shear maps! These are available from the ECMWF via both weather.us and weathermodels, and the GFS (which is free to use!) via weathermodels.
- Atmospheric Moisture
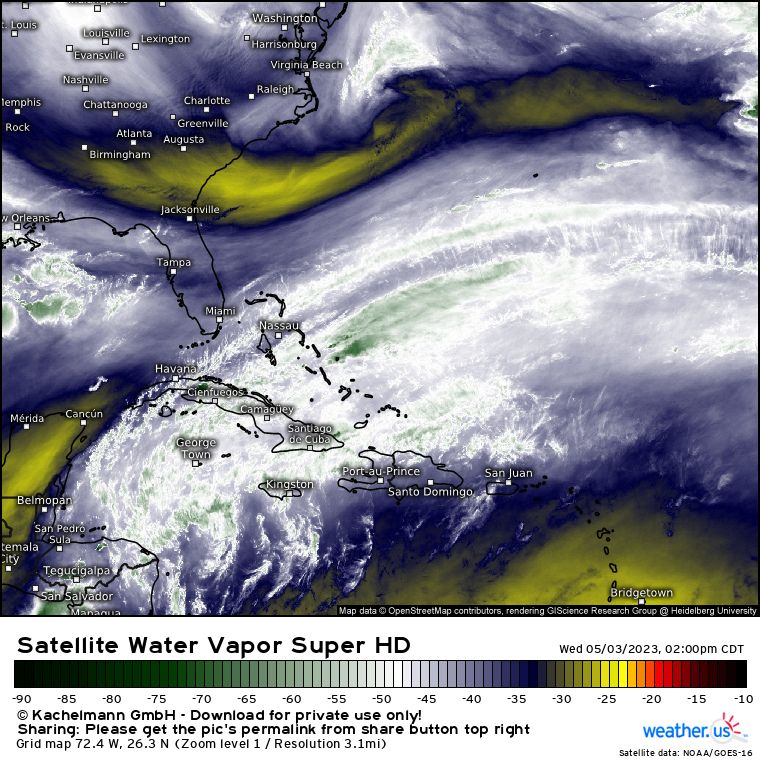
Dry air in the atmosphere can be a hurricane killer. Hurricanes require a moist environment not only to get going, but to continue strengthening. Identifying pockets of dry air downstream can help to forecast whether or not a hurricane will survive, weaken, or strengthen. We have real-time water vapor satellite imagery available at weather.us. You can use the free zoom setting to pick any area of the globe to analyze.
Weather.us Link Weathermodels Link
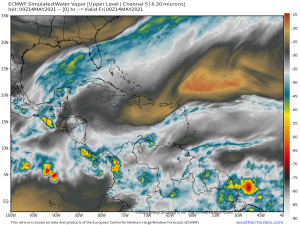
Real-time water vapor imagery is helpful in certain situations, but forecasted (simulated) water vapor can help in assessing what a hurricane may encounter in a day or two upstream. Both weather.us and weathermodels have simulated WV imagery via the ECMWF.
- Tracks
Weathermodels Link Weather.us Link
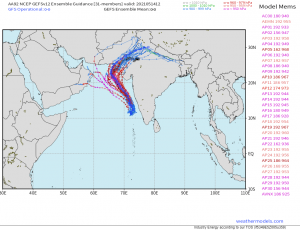
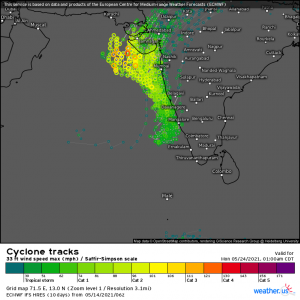
Everyone likes to know where a hurricane is predicted to go. With Cyclone Tracks maps, you can see the spaghetti plots of possible tracks. The weather.us map is based on the ECMWF ensemble while the maps from weathermodels (available in the “Special Charts” section) include tracks from a variety of models such as the GEFS, EPS, UKMET, and KMA.
- Probabilities
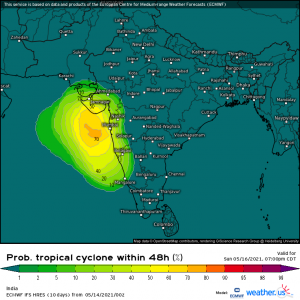
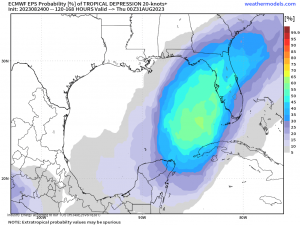
Perhaps you’ve noticed an area of low pressure that has a chance to develop in the next few days. If you’re curious about the probabilities of it becoming organized, hop on over to weather.us’s Probabilities tab via the ECMWF. You’ll find maps that display prob. of tropical depression within 48 hrs, prob. of tropical storm within 48 hrs, and prob. of tropical cyclone within 48 hrs.
- Forecast Location of the Low
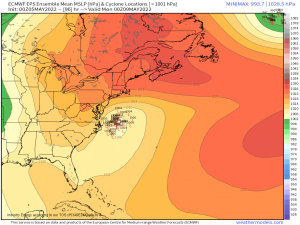
Ensembles can be useful when there is a degree of uncertainty. Tighter clustering indicates more certainty while scattered members equates to great uncertainty. Maps like the Ensemble Mean MSLP available on Weathermodels.com via the EPS and GEFS can help when you’re trying to pin down the future location of that tropical low.
- Satellite Imagery
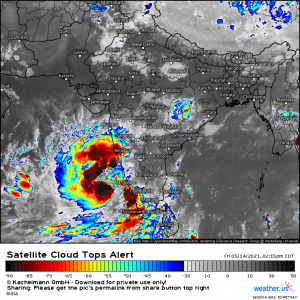
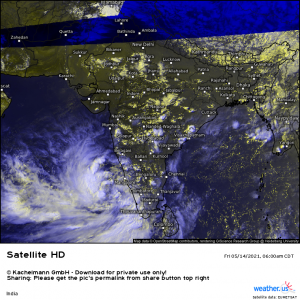
Cloud Tops Link Satellite Link
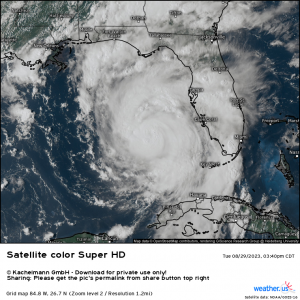
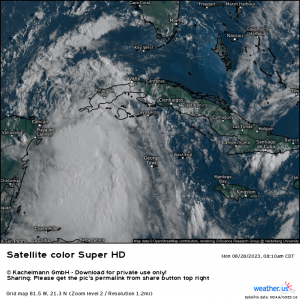
We all know satellite imagery is useful when observing and forecasting hurricanes. Weather.us has satellite imagery for every part of the globe with a variety of enhancements available. We already talked about the water vapor imagery earlier so now let’s mention Cloud Tops and Satellite HD. Cloud tops are useful for identifying a strengthening hurricane. Colder cloud tops indicate the presence of convection and therefore a storm attempting to strengthen. As for the Satellite HD, it can be used not only to view the extent of the storm but to see if the upper and lower level circulations are stacked vertically, indicating the lack of shear and a storm ready to strengthen.
- Wind Speed
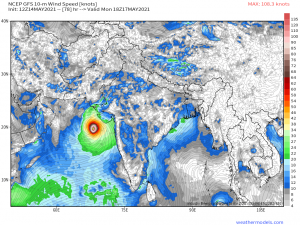
Weathermodels Link Weather.us Link
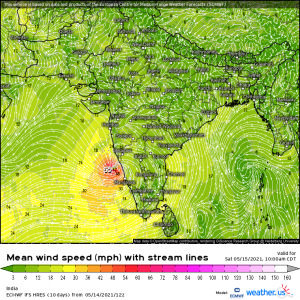
Both weather.us and weathermodels have maps for forecasted wind speed available via the ECMWF, GFS, ICON, and GEM. Weathermodels, however, also has maps from the HWRF and HMON available in the model lab. These two models are devoted specifically to tropical cyclones and have a variety of other parameters (SSTs, PWAT, etc) available as well.
- Steering Winds
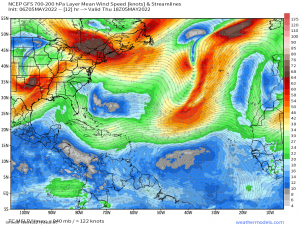
Once that storm forms, you’ll need to know in what direction the steering winds are flowing in order to predict its path. GFS Steering Winds maps can be found in the Weathermodels.com Model Lab. Choose from a variety of heights (200-700 hPa, 500-850 hPa, etc) to get an accurate look at the forecast flow influencing your storm.
These maps I’ve highlighted above are just a few of the many tools available at weather.us and weathermodels.com. I highly recommend exploring both pages to see what you can find that might be useful to you. Weathermodels is a paid subscription service BUT the GFS maps are free to use without a subscription. So, at the very least, go check those out if you’re not a subscriber. If you find any maps you have questions about, please don’t hesitate to drop us a line. We’ll do our best to answer any questions you can think of!

