The Downstream Impacts of a Recurving Typhoon on North America
The atmosphere across the entire globe is interconnected; One meteorological process in one place can have large to even small scale implications in another.
An interesting phenomena and great example of utilizing a long-range technique in this case, is the large-scale impact a typhoon has on Rossby waves – a technical term that simply explains undulations in the jet stream (i.e. Ridge, trough pattern).
This past week, Tyhoon “Tokage” intensified and reached a Category 3 status seen on the Saffir-Simpson scale. Since then, it has weakened and began its process of transitioning into an extratropical cyclone through a unique dynamic process as it interacted with the mid-latitude wave-guide.
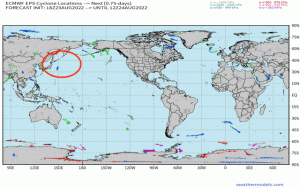
Initialized August 23rd, here are the global cyclone tracks via EPS through today. Ignoring all else, we can watch the forecasted track of the typhoon out across the Northwest Pacific, east of Tokyo and eventually toward the Bering Sea. In general, the track of the typhoon began its recurving several days ago up until yesterday before the atmosphere “absorbed” it within the mean flow.
Now what are the implications?
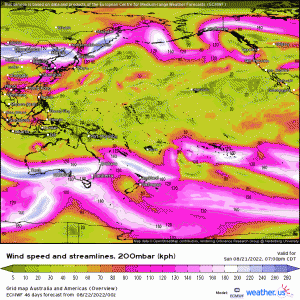
- Below presents the 200mb wind speed – essentially showing us the region of the jet streams. In this case, follow the Pacific jet. This displays the time period of August 21st to September 7th. Initially, the Pacific jet extending off East Asia and out into the Northern-Central Pacific isn’t really that amplified. However, it isn’t until later this current week and into early next week that all-of-a-sudden, we see zonal wind speed accentuate (jet streak embedded) to where values exceed 160mph in conjunction with a sudden poleward extension of it into the Northern Bering Sea. Then the exit region of the jet situates itself south of Alaska and fully extended by Labor Day Weekend, with another jet streak seen across Western/Central Canada. This typhoon, through intense diabatic processes (i.e. latent heat release!), has basically “kickstarted” and amplified the entire pacific Rossby-wavetrain and concomitantly the jet stream.
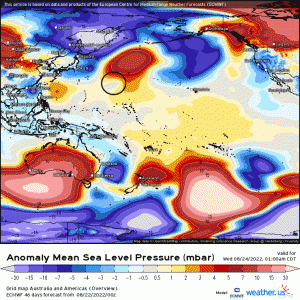
Using anomalous MSLP, I’ve highlighted to depict the typhoon’s track as it essentially recurves around a large-scale ridge and eventually undergoes extratropical-transition before being absorbed by the large-scale trough.
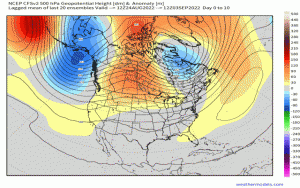
2. Lets take a look at the CFSv2 weekly z500mb height pattern through early-mid September, so indeed approaching long-range. In 5-day intervals, watch how the synoptic pattern unfolds across N.A.;
- Initially, a large-scale mid/upper-level ridge ejects eastward while an Aleutian low deepens upstream.
- The Aleutian low weakens and retracts.
- The large-scale Central U.S. ridge pulls back west and builds toward Alaska and British Columbia
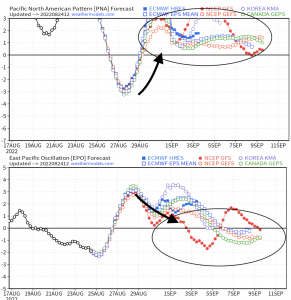
- A +PNA/-EPO pattern develops with below average heights settling east of the Mississippi River Valley with the Bermuda ridge nosing toward the Southwestern Atlantic; the latter would be a concern for any tropical development nearby the U.S. coastline most especially.
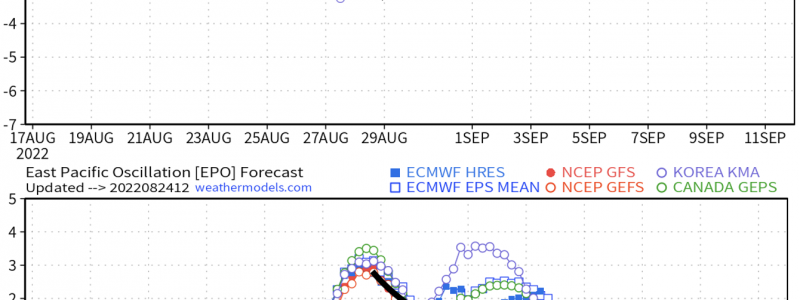
Corroborating the height pattern with the teleconnections including the PNA and EPO reveal nicely, the large-scale impacts a recurving typhoon may facilitate! Now it also does vary significantly regarding the intensity and track as not all typhoons are alike regarding their downstream impacts, but plenty of case studies, observations, and research have all illustrated a robust long-range correlation of a pattern that resembles what is shown via the CFSv2. An upward trend in the PNA (+PNA) and downward trend in the EPO (-EPO) resembles above average heights across Alaska and the West Coast, respectively; this configuration renders a trough downstream across the Eastern portion of the nation.
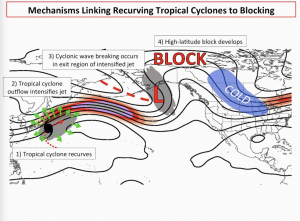
Lets quickly examine why this is the case, and how these processes manifest a signal that forecasters can utilize with confidence! For the sake of aesthetics and elucidation, I’m displaying a fantastic created graph from a wonderful person I’ve had the honor to engage in a plethora of geeky talks – Meteorologist John Homenuk – CEO & founder of NY Metro Weather (@jhomenuk).
Diving into this entire procedure, it begins with the typhoon’s track. Tropical cyclones are powerful heat “engines” transporting and carrying a tremendous amount of energy with it – this energy through intense upper-level divergence, irrotational outflow, and energy dispersion (I.e. up to the tropopause) amplifies the Pacific Jet (shown above in the animation). This then, leads to an extension and then what we coin as Rossby wave-breaking (like an ocean wave about to “break”), where we see intense divergence in the left-exit region of the jet streak, forming a large-scale trough. This trough, meridionally now deepened, amplifies a ridge downstream (i.e. -EPO – positive geopotential heights across Alaska, forming the blocking anticyclone). Now to the east of this large-scale ridge, cold air advection and positive MSLP (high pressure) flows down into the Great Lakes/Midwest region, developing below average heights (trough). This entire dynamic series of steps aligns quite well with what we see from the CFSv2, and has archived analog support to lead the way in rendering greater-than-normal confidence from a probabilistic standpoint.
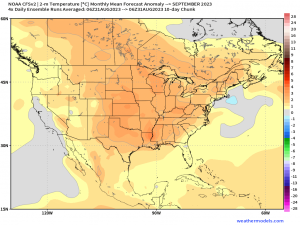
Not only does the CFSv2 hint at a synoptic pattern as such, but has agreement from other ensembles which isn’t too surprising! Hopefully this was an informative and interesting lesson!
