The Climatological Anomaly of the Generation: Northwest Heat in Context
I have long been fascinated by extreme atmospheric anomalies, the ‘perfect storms’ that defy climatology and set unfathomable records. Today, as the broiler finally eases on the Seattle/Portland/Vancouver corridor, it is abundantly clear that we’ve just witnessed one.
I wrote in my series on the West’s mega-drought that extremely dry soils build a foundation for record-breaking heat across the region. The parched earth prevents solar rays from being diverted to evaporating near-surface moisture, partitioning more of the energy to increasing air temperatures. Should ridging develop in a favorable position to promote Western heat, a near certainty in the summer, record-challenging heat would appear possible due to the drought. What I didn’t count on back then, however, was just how favorable ridging could be- that parts of the West would end up dealing with a confluence of highly anomalous dry soils and highly anomalous warm-season ridging.
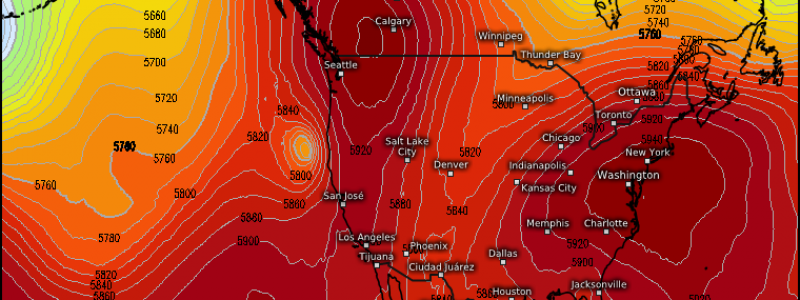
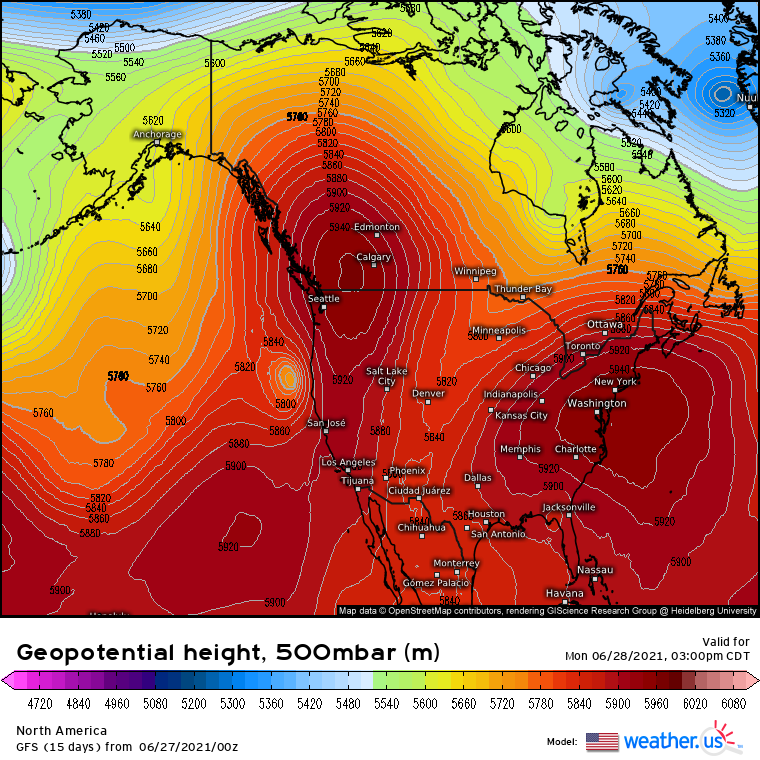
The latter developed this week in a hard to comprehend blocking pattern that sent midlevel heights skyrocketing on both US coasts. Out West, a particularly brutal type of ridge known as an ‘omega block’ formed, in which gridlocked troughs squeeze relatively high heights north like a tube of toothpaste. The shape of the resulting ridge can look like the Greek letter Ω, pinched off from below by two sluggish troughs. Check out the omega block as modeled for yesterday, a ridge massive in size and intensity just west of Calgary.
These extremely unusual midlevel heights, so unusual as to be largely outside of regional climatology, were also rendered effectively immobile by the gridlock downstream.
Midlevel ridges that sit still tent to reinforce themselves. They promote subsidence and clear, stagnant skies, which lead to anomalously warm surface temperatures. These hot conditions, in turn, physically expand the size of the lower atmosphere, increasing the magnitude of the ridge in a feedback loop that can cause dangerous heat waves wherever ridges stop moving in the summer.
With a ridge so immobile, so intense, so large, atop a ground so parched, this feedback was unusually pronounced over the Pacific Northwest. Easterly subsidence from the towering Cascades increased temperatures further and ensured the cooling marine layer not wander inland.
The unsurprising result of unprecedented* ridging and nearly unprecedented drought was unprecedented heat.
Temperatures swelled dramatically across the region to start the weekend, with many locations breaking monthly heat records and approaching or even tying all-time ones on Saturday. Sunday and Monday saw the unwavering ridge continue to raise the mercury, and by yesterday evening, it was clear a spectacular chapter in US climatology had occurred.
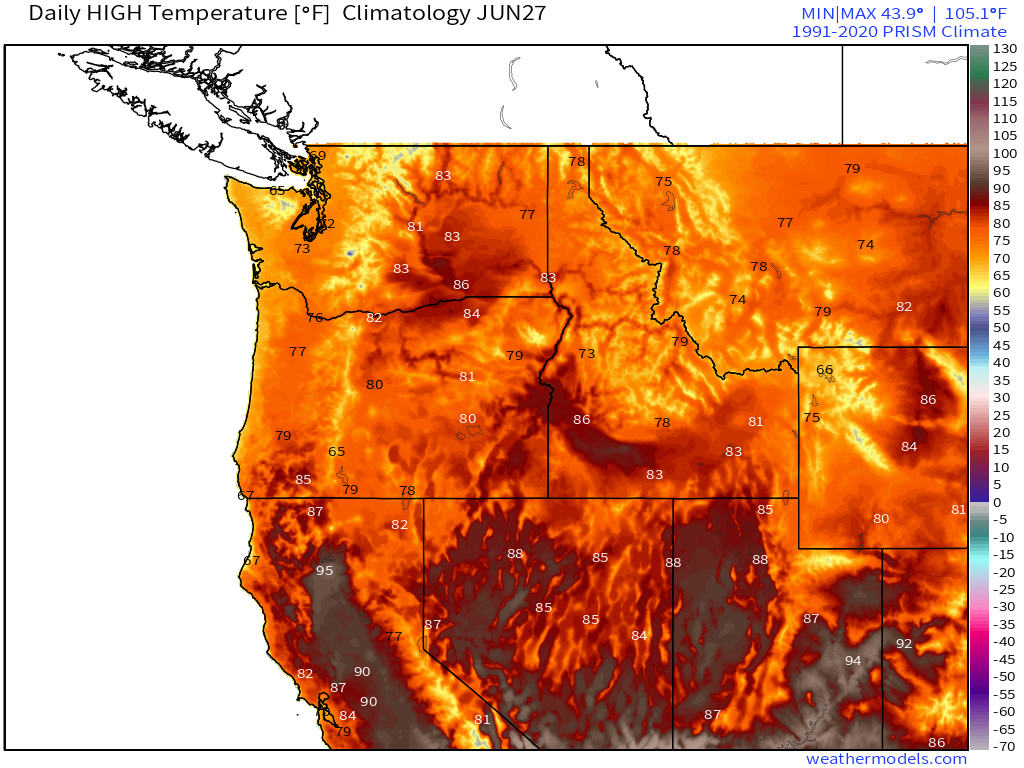
For context, this is what the temperature profile at this part of the year normally looks like in the Northwest:
Statistics from the heat wave are mind-boggling.
Portland, Oregon set an all time record temperature on Saturday, when the mercury climbed to an astonishing 108ºF. The previous record, 107ºF, was set in 1965 and tied in 1981. On Sunday, the intensifying heat broke the record set the previous day with an incredible 112ºF reading, breaking the record that had been set the day before and exceeding the previous record by an unbelievable 5ºF. On Monday, the station went even further, once again breaking the record set the day before with an astonishing 116ºF reading, a whopping 9ºF above what was, before last weekend, the highest temperature ever recorded there.
Read that again- of thousands and thousands of measurements taken at the Portland airport, no single one before last weekend came within nine degrees of the temperature yesterday. Furthermore, the three highest temperatures ever for the city happened in the last three days. Wow!
Saturday also saw Seattle smash the record for the month of June, recording a 102ºF temperature that exceeded the monthly record by 6ºF! It was only the fourth time the city had ever exceeded 100ºF, but they wouldn’t have to wait long for the fifth, which followed on Sunday. That day saw the mercury rise to 104ºF, which broke the all time record for the city by a degree. That record wouldn’t last long, and it fell hard Monday when the temperature rose yet again to an astounding 108ºF. In all of the thousands of measurements taken at the Seattle airport, none before last weekend had ever been within five degrees of the temperature Monday. A full half of the 100º+ readings ever taken there were measured since Saturday.
Coastal Washington had perhaps the most climatologically insane moment of the heatwave when, on Monday, a station called Quillayute broke the all time temperature record by an astonishing eleven degrees. That’s the most any North American station has ever broken an all time record by.
North of the border, Canada also set mind-boggling temperature records. On Sunday, temperatures in the British Columbian city of Lytton hit 116ºF, which set the record for the entire country by a whopping three degrees (F). On Monday, that record fell, too, as the city reached an astounding 118ºF. This beat the country’s record, as it stood before the weekend, by five degrees (F)!! Of surely millions upon millions of temperature observations in the country’s history, none before Sunday had been within five degrees of the temperature recorded on Monday. And then, on Tuesday, Lytton did it again, crushing Monday’s record with an unbelievable 121ºF reading. That an entire country as large as Canadas had its temperature record broken three days in a row, and that the highest of these readings would beat the old record by an astonishing eight degrees, is probably the most unbelievable weather anomaly I’ve ever heard of. Step aside, Great Appalachian storm of 1950.
As if the insanely tail-end temperatures described above seem just a little too tame, what makes these records even more incomprehensible is the time of year that they occurred.
June may have the longest days of the year, but temperatures actually peak for much of the US, including the I-5 corridor, at the end of July and beginning of August. This means all the aforementioned records were actually crushed at least a month before the climatological thermal maximum, an equivalent to NYC setting an all-time cold record in early December.
Additionally, the summer months see significantly less day to day variation than the rest of the year at the hands of the midlevel jet’s poleward retreat. This makes it much harder to get meaningful anomalies like those seen yesterday. For example, it was approximately 40ºF above average yesterday in parts of the Pacific Northwest like Portland. Looking elsewhere shows just how unusual this type of anomaly is in the summer: 85ºF in NYC on March 1st, 40ºF above average, would exceed the daily record by only 12ºF. But 123ºF in NYC on June 28th, also 40ºF above average, would exceed the daily record by 27ºF. Clearly, substantial temperature variation is much harder to achieve this time of year.
The heat seen in the Northwest over the last few days far exceeds legends of climatology that include March 2012’s heat and February 2021’s cold to become the most incredibly anomalous North American climate event in a long, long time. But as climate change makes the type of drought, and possibly the type of blocking, that spurred the heat more likely, don’t expect it to remain in lone company forever.
____
*I saw a tweet this morning that “unprecedented” is used too liberally nowadays. I’m inclined to agree, so I’m adding this disclaimer: when I say “unprecedented”, what I really mean is ‘unknown to have ever occurred before’. It’s never happened previously in modern record keeping as modeled by ERA5, which goes back to 1950, and seems quite unlikely to have occurred between the late 1800s, when people started paying attention, and then.



In the larger scheme of things, how unusual is this? How much of it do you contribute to climate change? You called it unprecedented because it likely hasn’t happened between the late 1800’s and now. I hate to burst your bubble, but that isn’t nearly enough time to truly understand the potential extremes of the tail ends. I’m only 55 years old (still feel like I’m 25 BTW), so that amount of time is roughly only 3 times my existence. That’s a blink of an eye!
Sure, we have proxies for estimating historical temperatures, and perhaps none of them show the extreme temps we just witnessed. But let me ask you this: If you could transport yourself 1000 years into the future, what do you think you’d see if you were to use those same techniques to estimate the temperatures 1000 years earlier? I can tell you what you would see. You’d see nothing out of the ordinary. A few days of abnormally high temps likely wouldn’t show up. Honest question: How granular are the reconstructed temps from 500 or 1000 years ago? Does it get any better than annual…or seasonal? I know you can’t pick out a few days.
The real question we should be asking is what period of time does the temperature record need to cover before we can truly understand the “normal” extremes for a given geologic/climatic period? Is it 500 years? 1000 years? I don’t have the answer, but I’m quite confident that 150 years is not even close to long enough.
Hi, author here.
First of all, I’m glad you picked up on the important note I left. Science, and myself, agree with you- we can’t know much more about temperature records than what happened over the last 150 years. I left the note because I felt it would be disingenuous to pretend we know more than we do about these records than we do.
To answer your actual question- I believe the short time span should not be confused with uncertainty over the significance of these records, and I believe 100-150 years of data is enough to say that with confidence. Records fall regularly, but this many records falling by this large a margin is really unheard of. I say that not only based on the data from the PNW stations, on what is considered a ‘normal’ record magnitude there; but on data from stations all over the globe, which show how the type of records set this last week are anything but normal. The data points I synthesized when writing about the extremity of the records set do not number 150 years x 365 days x 2 measurements a day, but 150 years x 365 days x 2 measurements a day x thousands of stations across the world. That’s a lot of data.
Agreed, but regardless of the many thousands of measurements taken, it still covers a period of only 100 – 150 years. It is most definitely highly unusual over that time span, but the evidence isn’t sufficient to convince me that it is unprecedented over a much longer time span. With that said, I certainly can’t say you’re wrong. HAHA…let’s discuss this further in June of 3021, perhaps over a cup of coffee during a flight to Mars. 😉 Perhaps we’ll have some answers then.