Forecasting Low Pressure is One Thing, But What About High Pressure? An Explanation Through Jet Streaks!
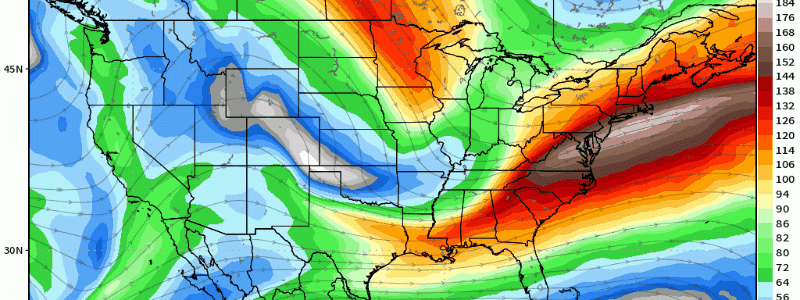
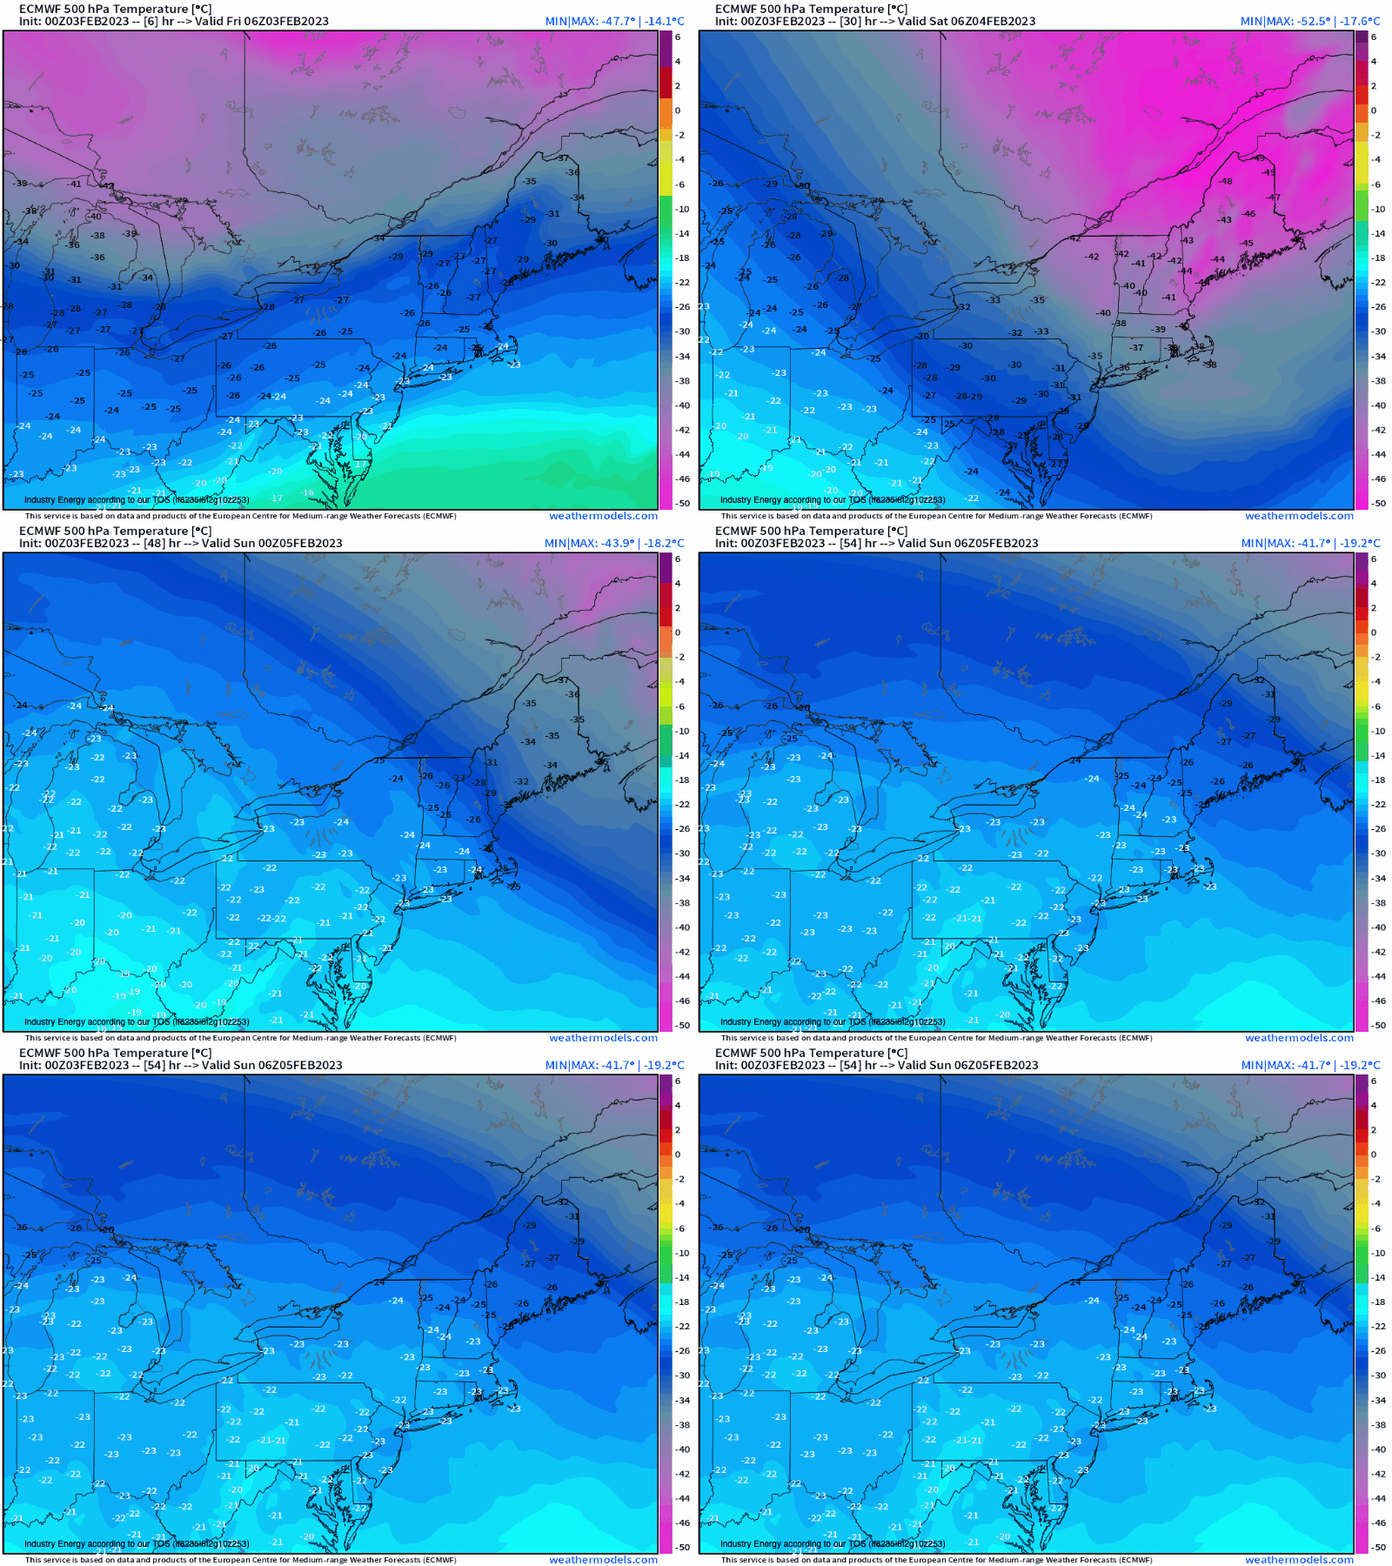
I think it’s been stated quite well this week leading up to now, that we’re going to be dealing with a swipe of a piece of the tropospheric polar vortex. Looking at it from 500mb, you notice a core of -40*C and below, swing through the Northeast. This is looking aloft in the mid-levels, but what about going higher to 200-300mb?
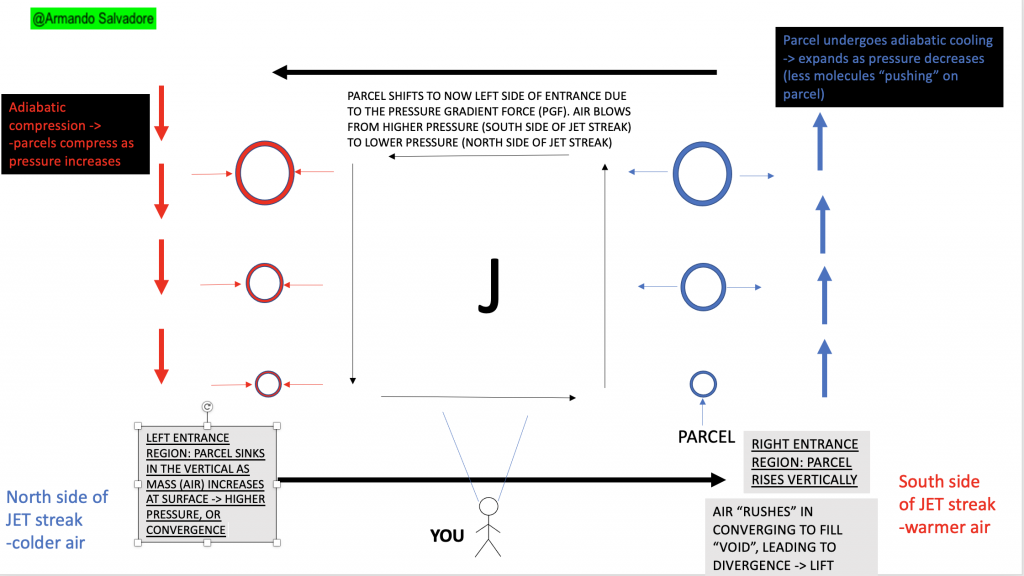
Taking a trip down memory lane quickly from a blog I published last fall discussing how meteorologists forecast using the “top-down” approach, here is a graphic I created below from that blog, to help make it visually receptive of how air rises and sinks in the jet core. We specifically are zoning in here on the entire left side of the graphic, where the parcels are sinking in the left-entrance region. Again, this is the entrance region, but remember when now going through the jet streak, the circulation switches once we get to the exit region. So take what you’d see below, and flip it so that the sinking parcels are now occurring on the right-hand side and rising air is occurring on the left-hand side.
Now, taking the above lesson, let’s analyze the 250mb level denoting where jet streaks are (outlined below). This arctic air mass, short-lived outbreak is an ideal example of how jet streaks enhance the surface pressure in the boundary layer. We know that by quadrating a jet streak, that the “left-exit” and “right-rear” entrance regions are where we look for air to rise and enhance lowering pressures at the surface; but, what about the “left-rear” entrance and “right-exit” areas? It’s simply the exact opposite, and it’s under these specific exit and entrance regions that we expect for surface high pressure to exist. I helped to point out where parcels are rising and sinking to show where we’re exactly looking.
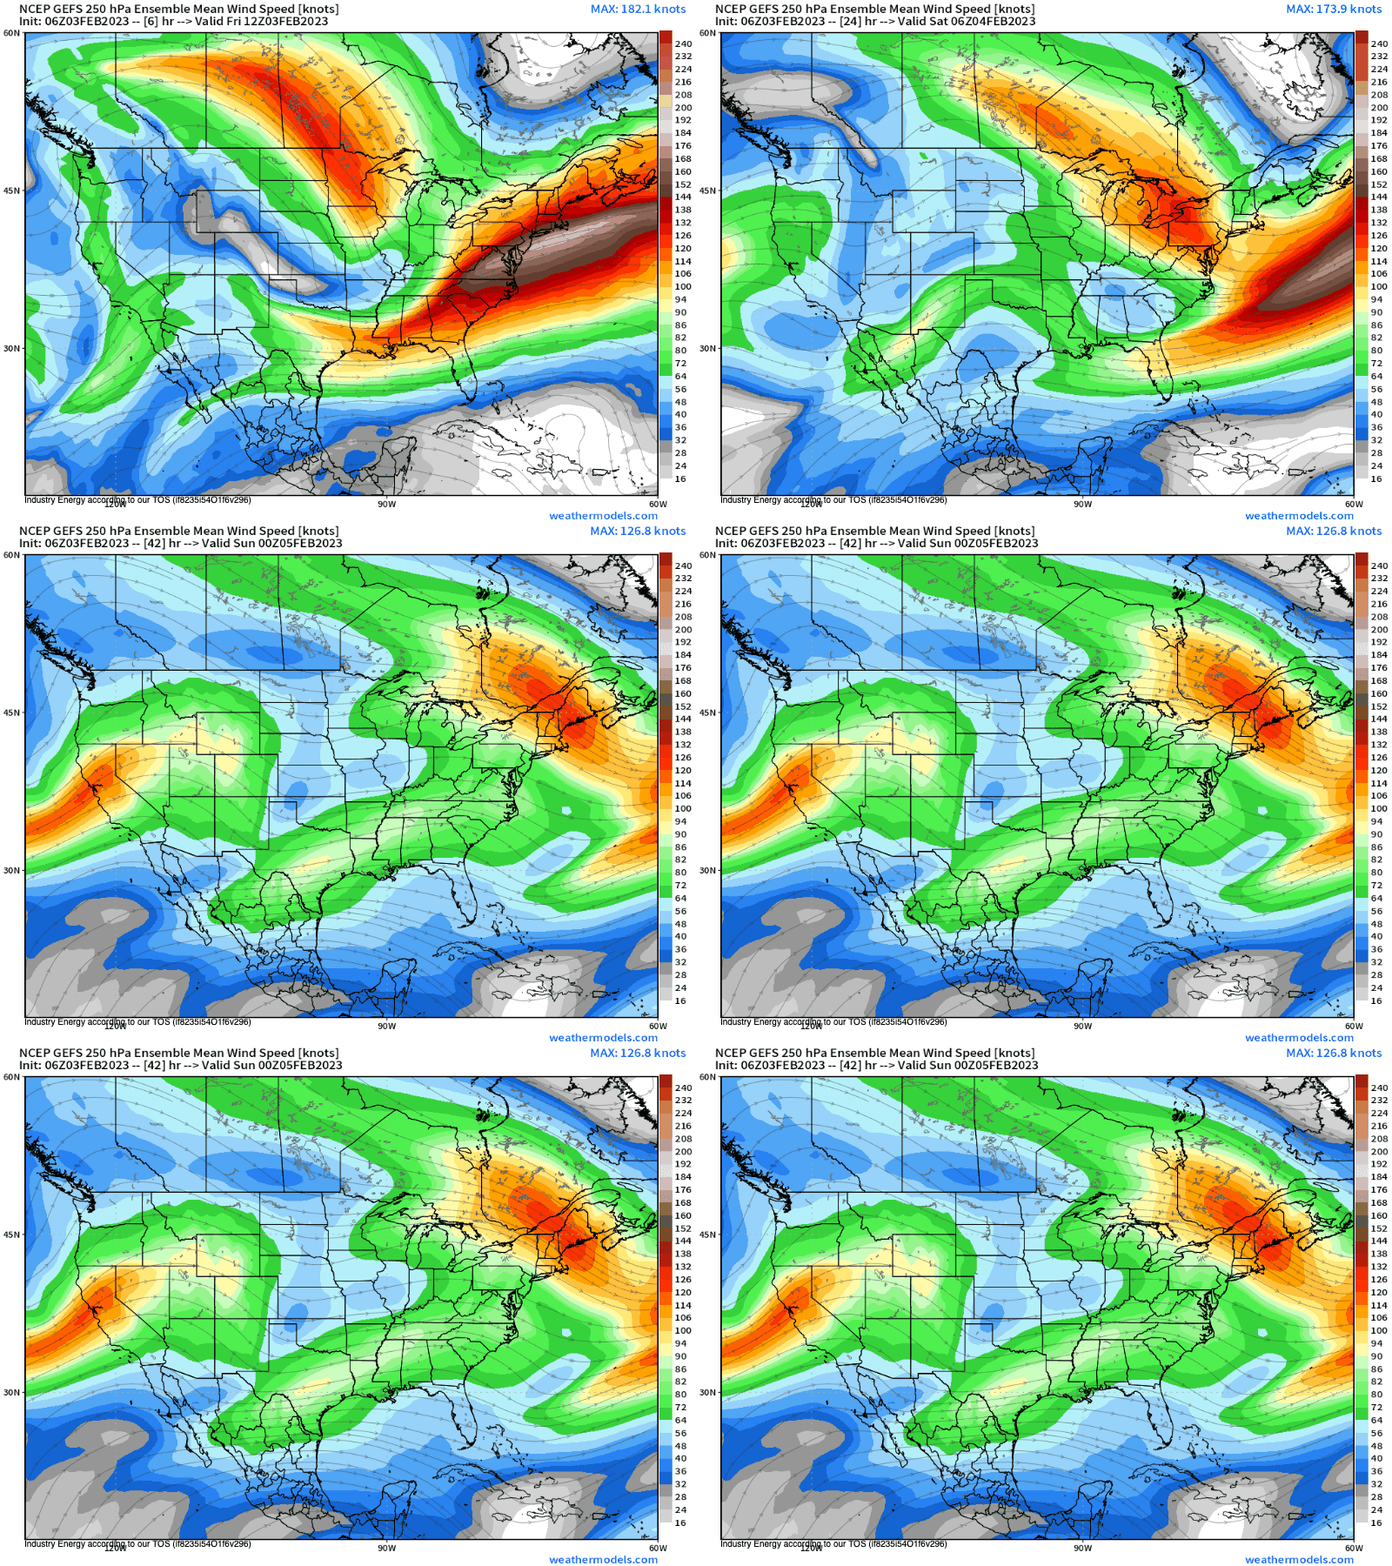
Finally, comparing aloft to now the surface (once again, how the top of the atmosphere influences the boundary layer), look where we see anomalous high pressure. It’s no coincidence that the high pressure below, aligns right below both the right exit region of the first jet streak that crosses the Great Lakes AND the second jet streak that propagates offshore. So not only do we have one jet streak, but two making this a “double-barrel” jet configuration that is augmenting the strong, arctic high pressure system.
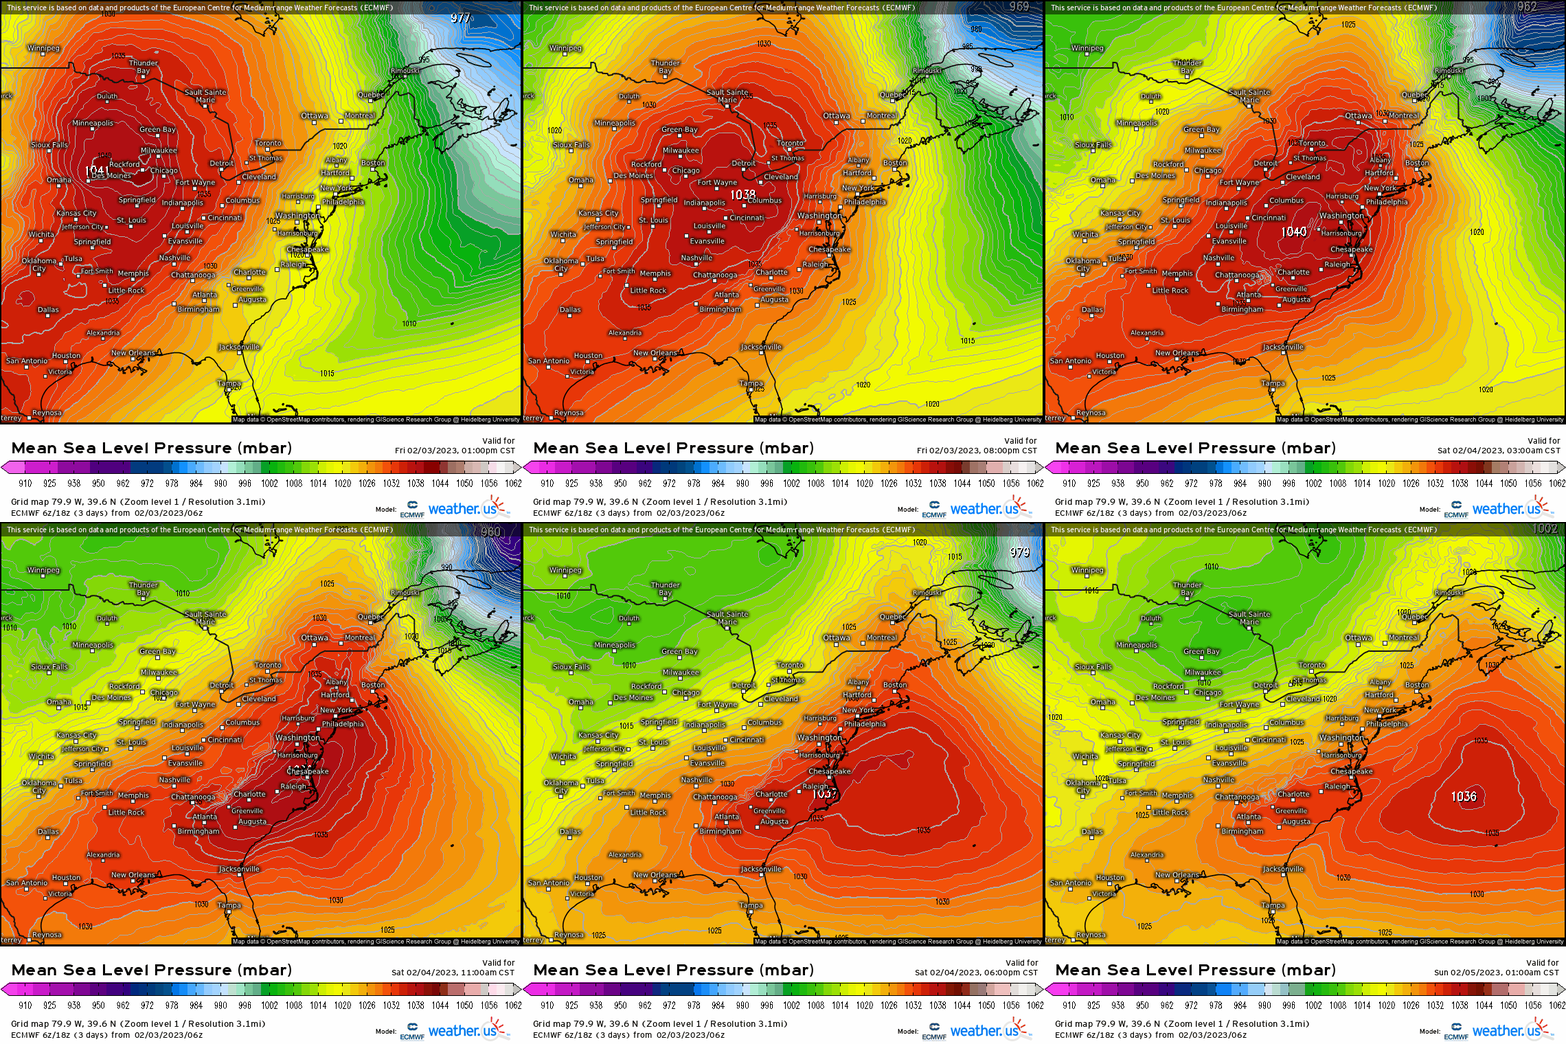
So as you can see, by just analyzing the winds aloft using the 200-300mb levels, one can visualize what the surface may experience or where a high pressure system could be. It’s a very nice example of positive feedback, where aloft influences the surface and continues this process until stabilization manifests where the atmosphere achieves near equilibrium.
