Differences In Trough Axes: Real-Time Examples This Week!
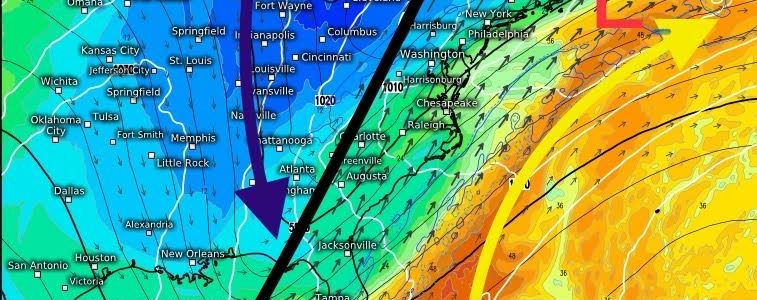
This week, we have two different storm evolutions that are excellent examples of in the differences of their respective trough axis. Leading up to today, we had an evolution of one shortwave trough that dug itself into the Southwest, and lifted northeastward while it began to tilt its axis. We see this below outlined and annotated in the black as I reveal below. This specific storm is expected to impact today the upper Midwest and into the Ohio Valley with heavy rain, and some backside snow across portions eastern IA, WI, and into MI.

Now, at the surface, what we see is that with the negatively tilted trough, a stronger surface low. Here, we see that the low will continue to intensity a bit through today before going on to weaken by tomorrow. Notice that the pressures get to nearly 990mb, which is fairly strong in the absence of available latent heating (i.e. ocean source). Lets compare this system now, to the positively-tilted trough that follows below.
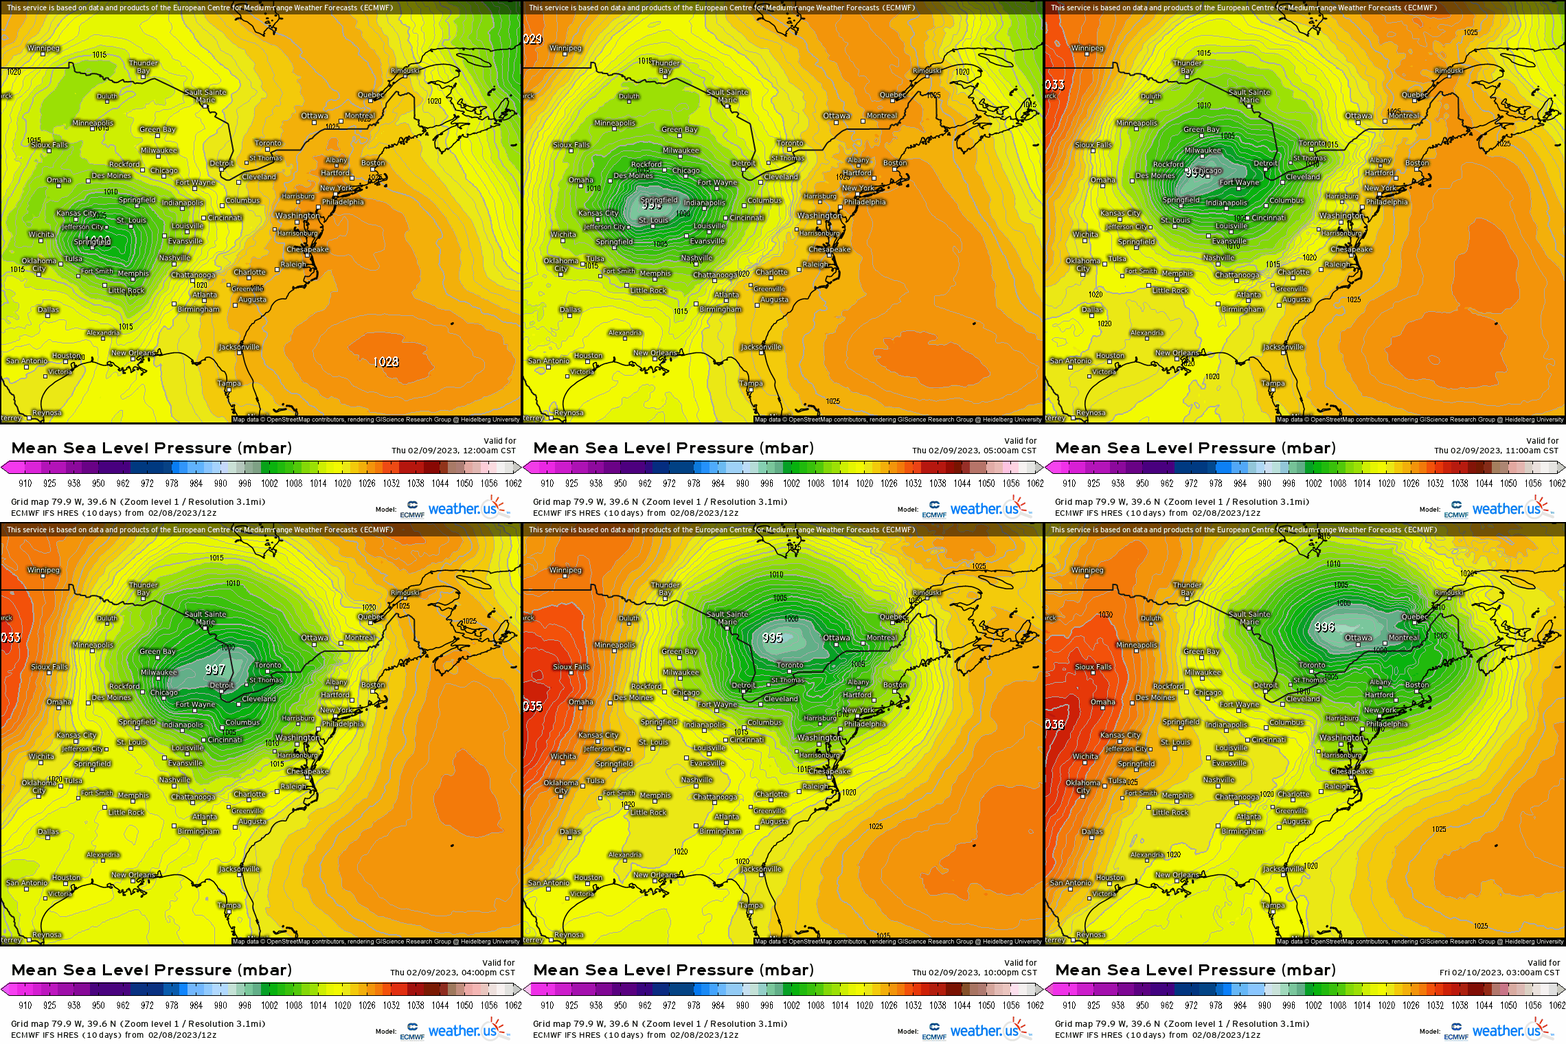
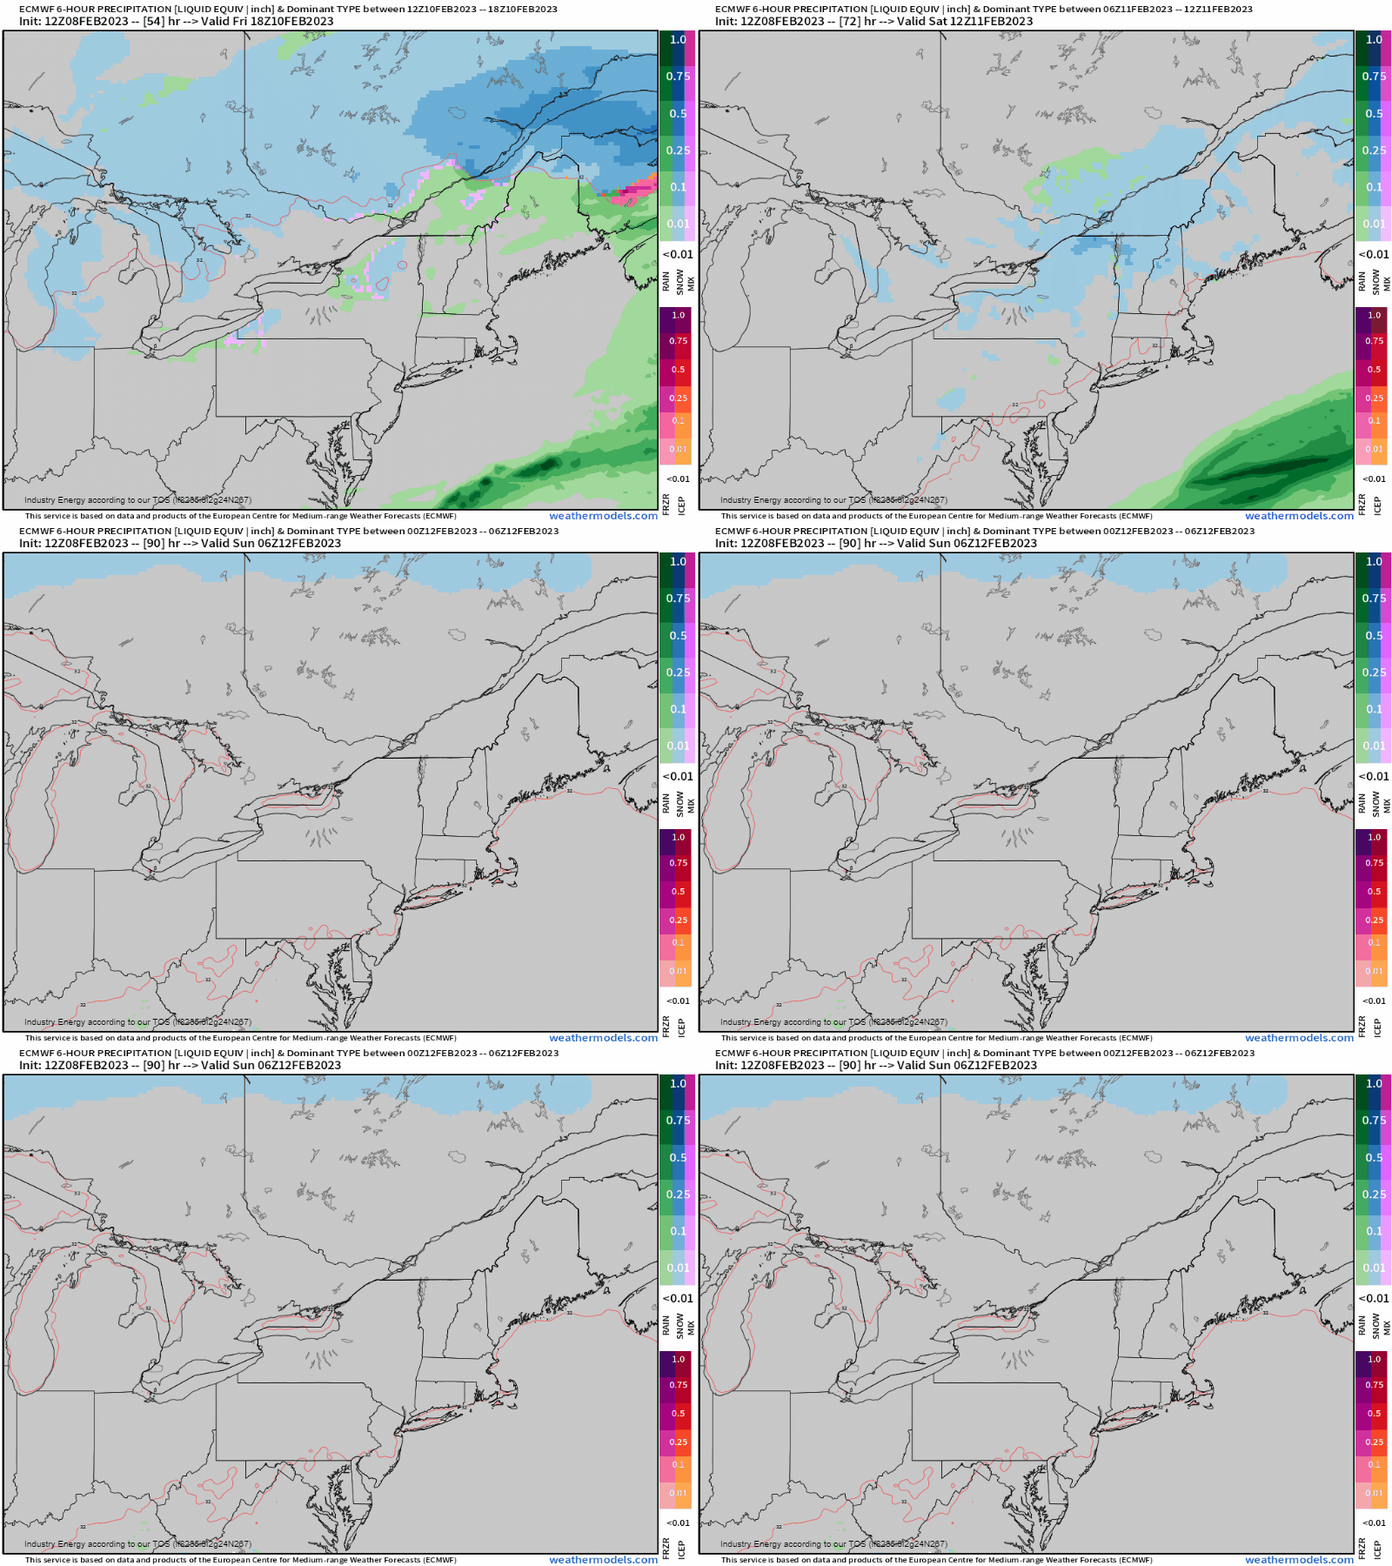
It’s behind this system in particular, that a northern stream disturbance (trough axis depicted further above as positively-tilted), where it zooms by offshore. We see this aloft at 500mb by depicting the trough’s tilt axis (positively-tilted is oriented SW to NE, whereas negatively-tilted is NW to SE) of how flat and progressive it is. What we see then at the surface is a weak frontal passage with some snow showers behind given the unidirectional flow, but the key point here is notice the true lack of any defined low level circulation or low pressure for that matter this weekend across the Northeast.

Utilizing the synoptic composite parameter, it’s really a great way to visualize how several levels of the atmosphere work together in a baroclinic environment, and what exactly is happening synoptically. Here for the Midwest system, we have our negatively-tilted trough axis. The shaded coloring represents theta-E, or measure of heat & moisture (850mb), while the black thicker lines are height contours (500mb – mid-level steering flow), and the white isopleths are surface pressure contours (1000mb). Arrows are also indicative of the upper level winds at 300mb. We see below, a much more meridional setup. As the trough axis here is in a negative tilt (NW to SE), this amplifies thermal and moisture advection, which has a unique positive feedback until it ceases. Warm air is increasing as a result of a pressure gradient in the warm sector (oranges/yellows), and on the backside cold air advection is simultaneously happening. We also have moisture, which is transporting heat (latent heat) from the Gulf. All together, we’re seeing pressures at the surface continue to fall, thus causing surface convergence. This is how a positive feedback manifests because it’s a cycle that continues (i.e. thermal advection/cyclonic vorticity advection, lifting, air rushes in and converges, and repeat) until the atmosphere stabilizes.

As for the Northeast setup, we see the trough axis positively-tilted. This inherently causes weak thermal advection, and weaker thermodynamics and kinematics (i.e. motion). We see there’s no tightening of a thermal gradient, as the best heat transport is well ahead of the axis, along with weak cold air advection on the backside of the trough. Notice the overall progressive nature of the entire flow surrounding the trough itself, as everything is pointing toward the Northeast rather swiftly. This forces everything to shift quickly across the Northeast, as it’s a progressive evolution.

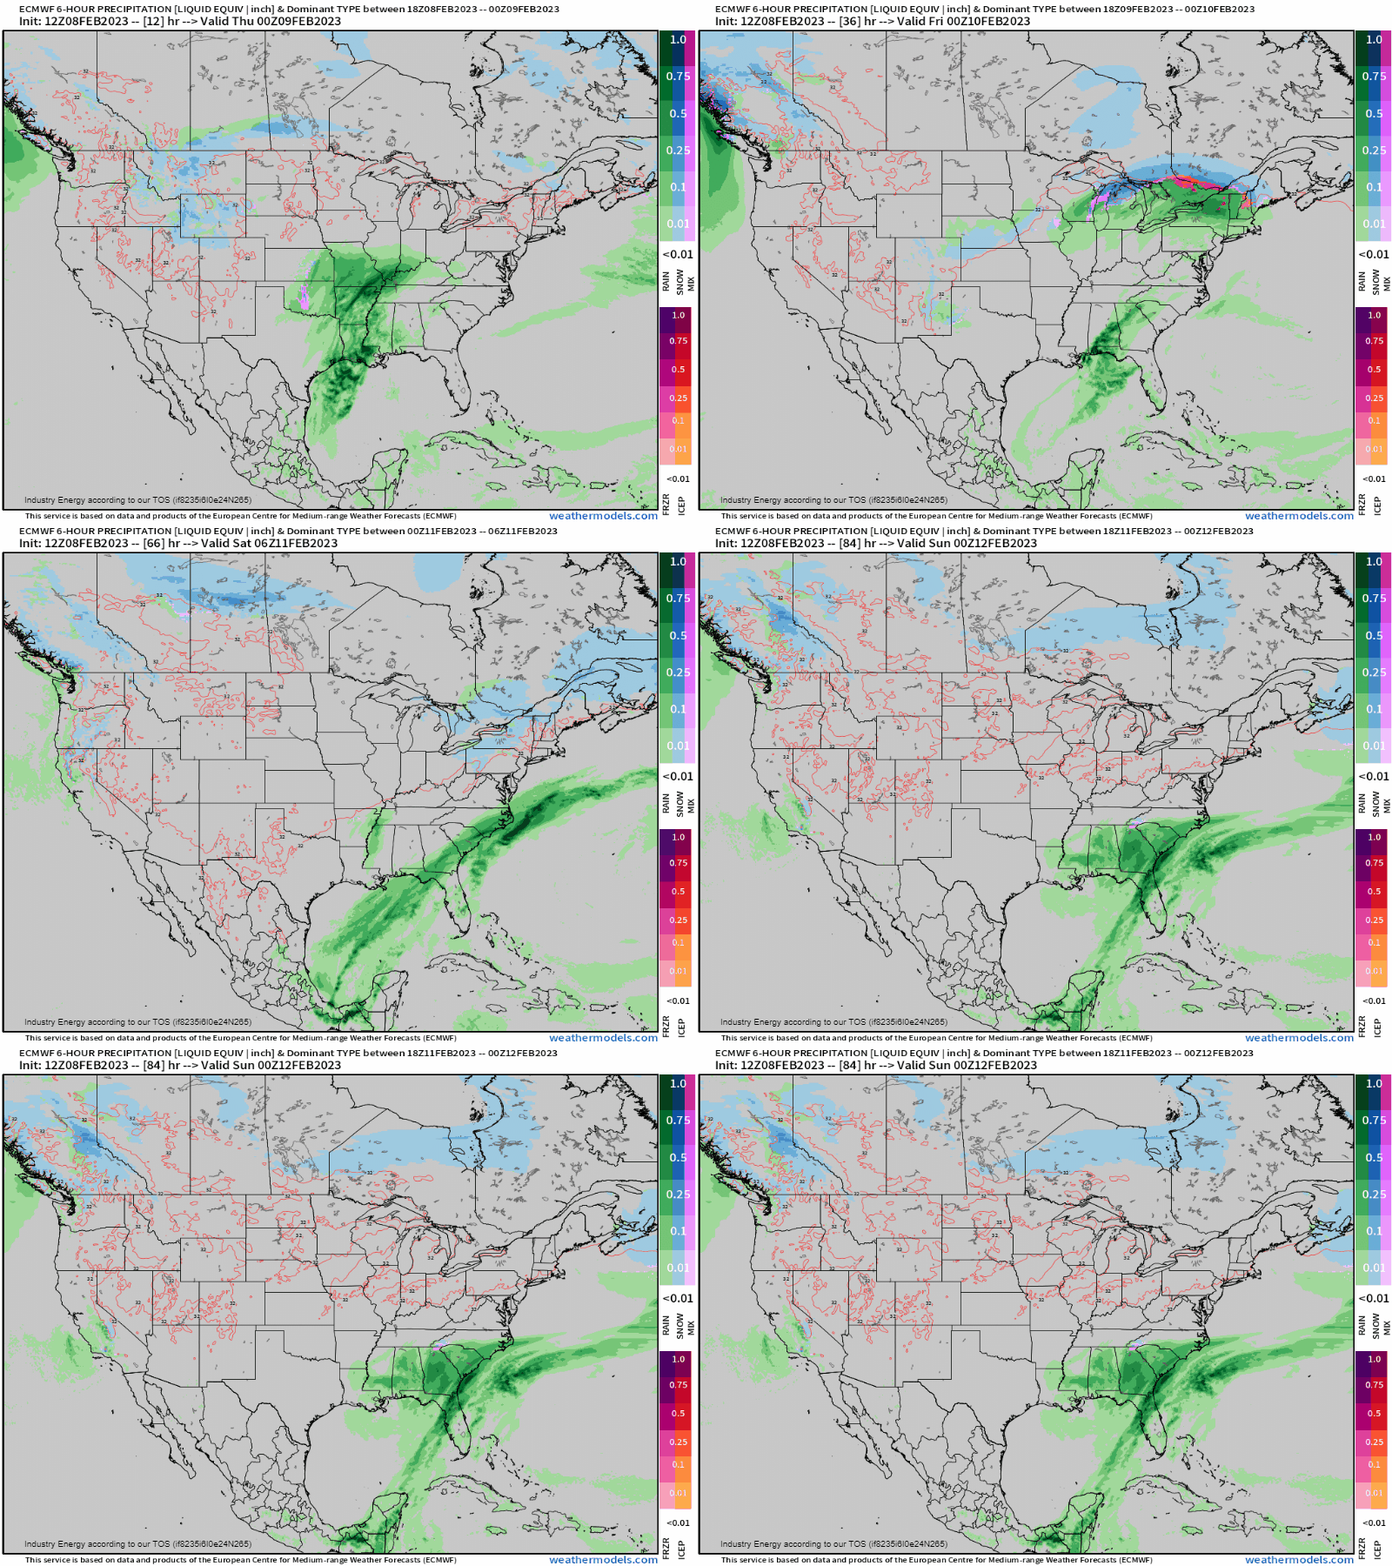
So playing this out now within an animation as we can distinctly see the responses in the magnitude of precipitation intensity & type. The Midwest system develops a “comma” head as it strengthens where it develops a maturing cold and warm conveyor belt. Contrast that to the weak area of snow and some rain through later Saturday with the northern stream (and positively tilted trough axis) that cross the Northeast region.
So hopefully it can be viewed in a more elucidated way now that we can actually see the differences in the responses to how a trough’s axis directly effects what happens at the surface by analyzing two scenarios within the same week. It becomes even a much more fascinating evolution once a trough axis becomes tilted offshore over the ocean because of simply how much sensible and latent heating is facilitated due to the tremendous amount of energy that is stored in water! This is why Nor’easters reveal such magical structures and how the Northeast during the winter months have seen such prolific snow events because of the atmospheric processes that are rendered!
