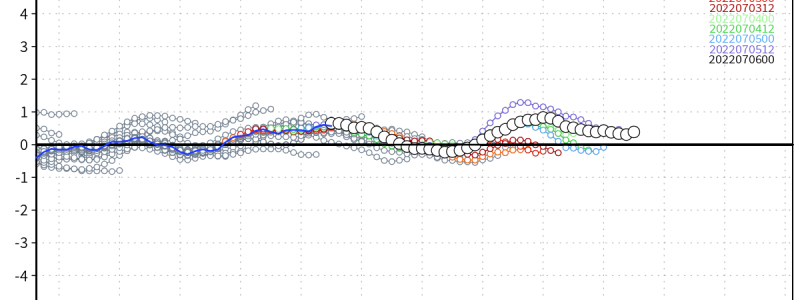
An Introduction to Teleconnections
Our atmosphere is a fluid. The weather in one part of the world inevitably has impacts on the type of weather that occurs later on downstream. One way to analyze these impacts is through the use of teleconnections.
The “official” definition for teleconnections is: the link between weather patterns and changes occurring in widely separated regions of the globe. That’s really just a fancy way of restating what I wrote in the second sentence of this blog.
Anyway, today I’m going to cover the teleconnections found in the WeatherModels Special Charts sections. Hopefully by the end of this blog, you’ll have a better understanding of what types of weather can be expected from the phases of each of the connections we’re about to discuss.
One disclaimer: keep in mind that you can’t determine the weather from a single teleconnection. These all work together and produce different results based on combined phases. The intention of this blog is just to give basic knowledge of a few of the teleconnections and their phases.
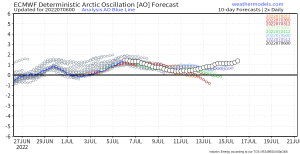
Arctic Oscillation (AO)
Though this teleconnection cycles throughout the year, it is of most use in the winter as it can help determine periods of colder than average weather for the US.
Negative Phase:
- Blocking exists in the Arctic
- This slows the flow at high latitudes
- Allows colder air to “spill” into the mid-latitudes
- Results in colder than average temperatures for many
Positive Phase:
- No blocking exists
- Flow moves along without any slowing
- Arctic air remains “locked” in at higher latitudes
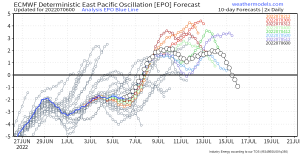
Eastern Pacific Oscillation (EPO)
This teleconnection is based on the placement of highs and lows in the Northeastern/Subtropical Pacific. Like the AO, it is of most use in winter forecasting.
Negative Phase:
- Ridge of high pressure over NE Pacific/Alaska
- Low pressure in the subtropical Pacific
- A more amplified ridge may lead to cross-polar flow, allowing Arctic air to spill into the US
- Warm weather for Alaska
Positive Phase:
- Persistent/large low in the Gulf of Alaska
- High pressure in the subtropical Pacific
- Jet stream runs between these two features bringing mild air to the west and keeping Alaska cold
- Warm pattern for the Lower 48
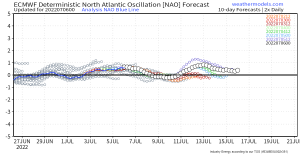
North Atlantic Oscillation (NAO)
The NAO is useful during the winter, but can have a big impact on weather in the Lower 48 regardless of season, especially in its negative phase.
Negative Phase:
- Weaker than normal subtropical high
- Weak Icelandic low
- Can lead to a blocking high near Iceland
- Obstructs the flow, causing stagnation
- Can result in warmer than normal temps in summer for the Eastern US
- Can result in an increase in tropical activity in the Atlantic basin
- Blocking high focuses rising air in the tropical Atlantic
- In the winter, can cause troughs to dig deeper over the Eastern US resulting in bigger storms/more phasing
- May lead to more Arctic cold crossing into the lower 48
Positive Phase
- Stronger subtropical high
- Deeper Icelandic low
- Increased pressure gradient leads to more storms crossing the Atlantic on a northerly track
- Results in mild and wet winters in the E US
- No blocking to force amplification of troughs
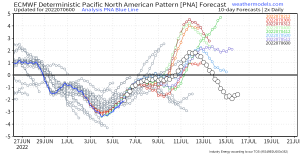
Pacific North American Pattern (PNA)
The PNA is useful in any season. It gives insight to the upper air pattern, helping to predict where troughs and ridges will form and, consequently, who receives warmer/colder temperatures.
Negative Phase:
- Troughing in the West
- Ridging in the East
- Colder than average in the West
- Warmer than average in the East
Positive Phase:
- Troughing in the East
- Ridging in the West
- Colder than average in the East
- Warmer than average in the West
As mentioned, the phases of these teleconnections can combine to produce anomalous weather.
For example: a -NAO, -AO, -EPO, and +PNA at the same time would likely be an indicator of a colder and stormier period for the Eastern US during the winter. This is the type of pattern that produces the blockbuster Nor’easters.
If we reverse that and have a +NAO, +AO, +EPO, and -PNA, it would be an indicator of a more mild period with weaker storms for the Eastern US during winter.
I hope you enjoyed this brief introduction to teleconnections.
As always, if you have a topic you’d like covered in a future blog, please shoot me a message either here in the comments or via Twitter. I would love to work your topic in!
***All graphics from Weathermodels.com and are available in the Special Charts Section via the ECMWF, EPS, GFS, and GEFS***



Thank you for this explanation.Very helpful.
Brian Woodruff