An Active Storm Track Shaping Up Next Week : Midwest, Ohio Valley, & Northeast
A temperature gradient, or more technically a “baroclinic zone”, will become established next week. What this tells us is that an active storm track will establish somewhere as a gradient leads to a difference in pressure. This difference is what results in lower-than-average pressure, causing a pressure gradient. Furthermore, add in available moisture via advection from the Gulf and Atlantic, and this provides several opportunities for all types of precipitation.
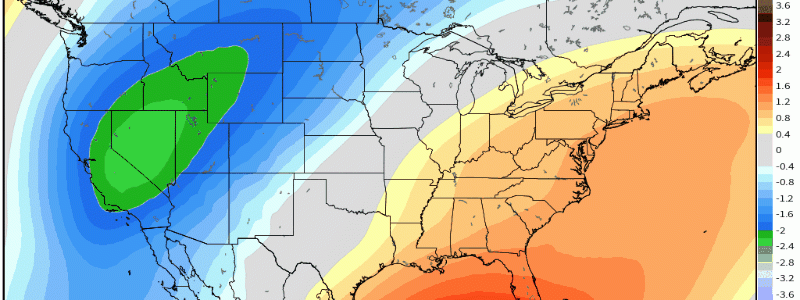
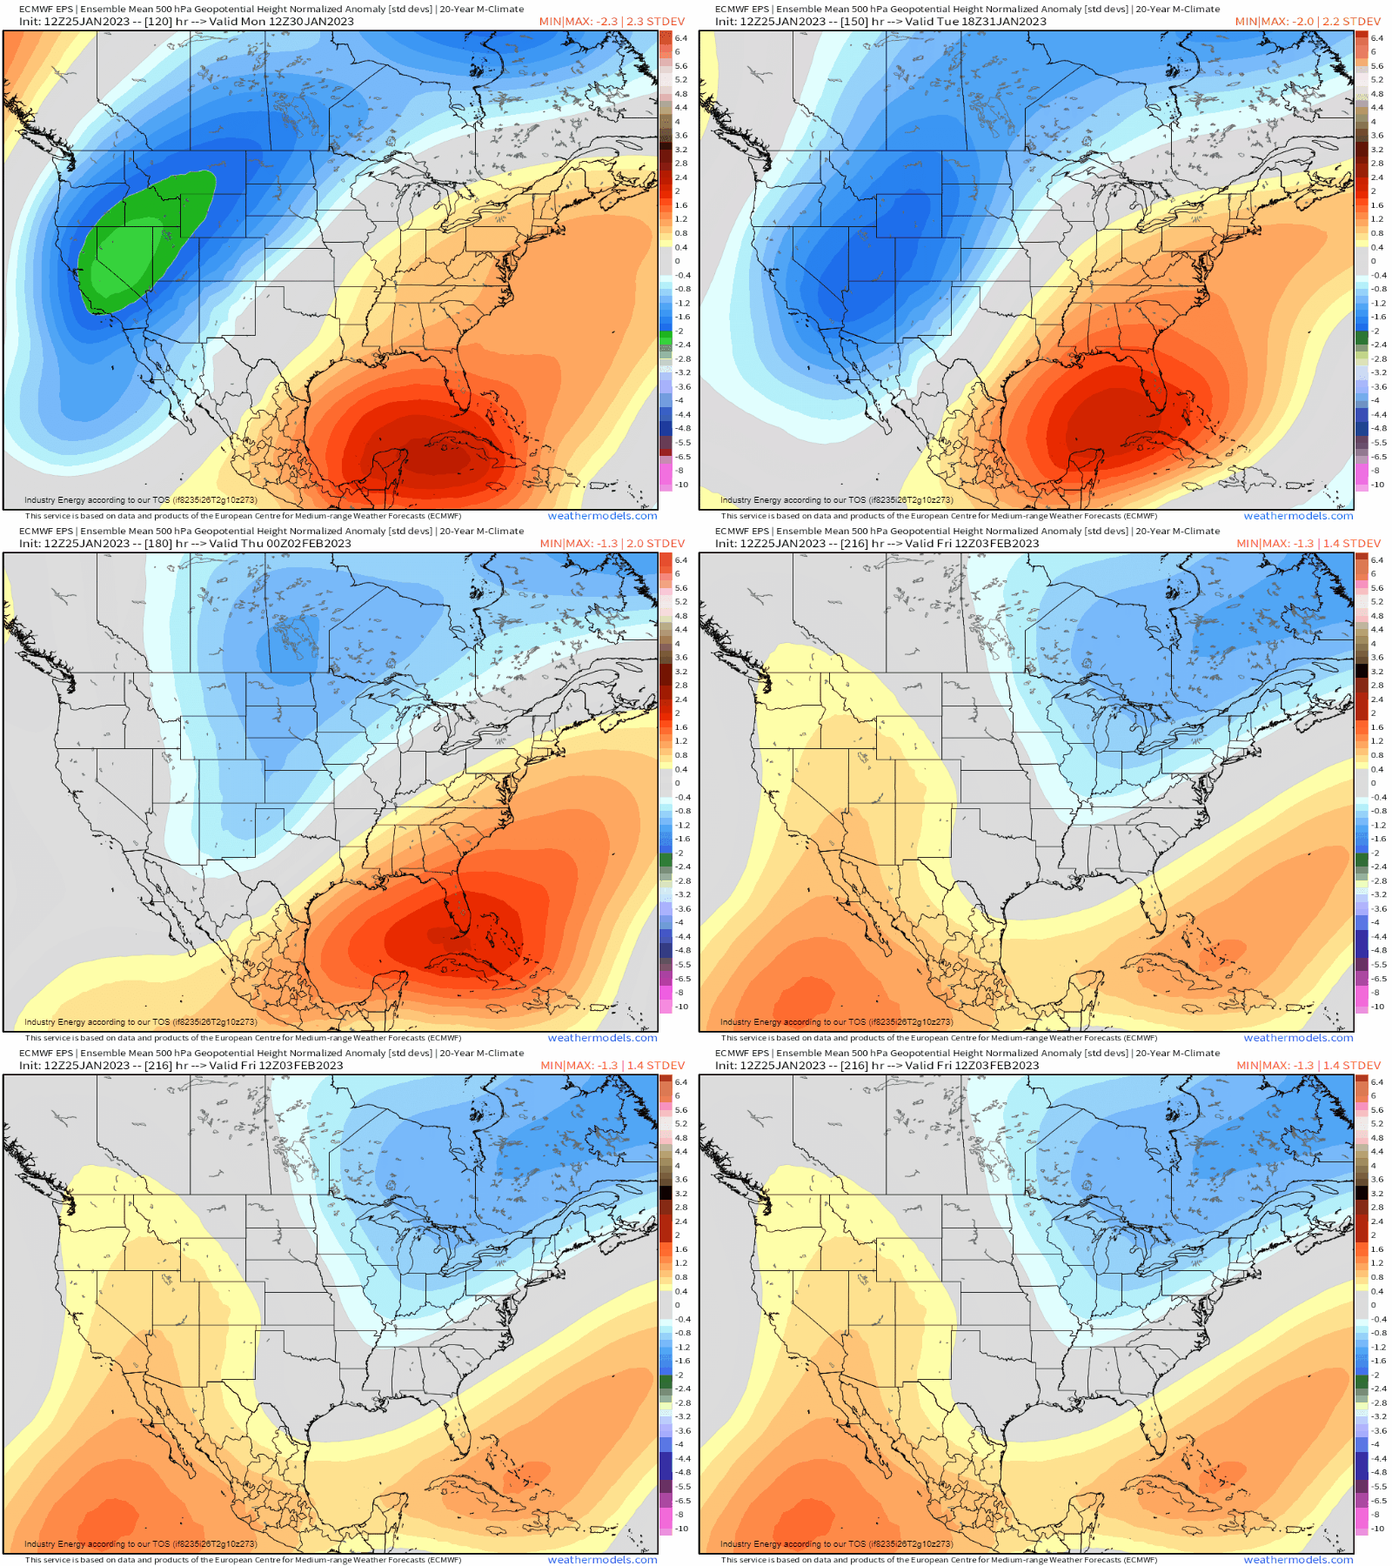
First, lets look aloft at the mid levels (z500mb). You can verbatim, make out almost like a trajectory or path of where there may be above normal activity regarding precipitation. Notice how this is revealed between the western trough and southeast ridge. In between is that “clash” of the temperature gradient that manifests an active storm track before the shift rolls eastward.
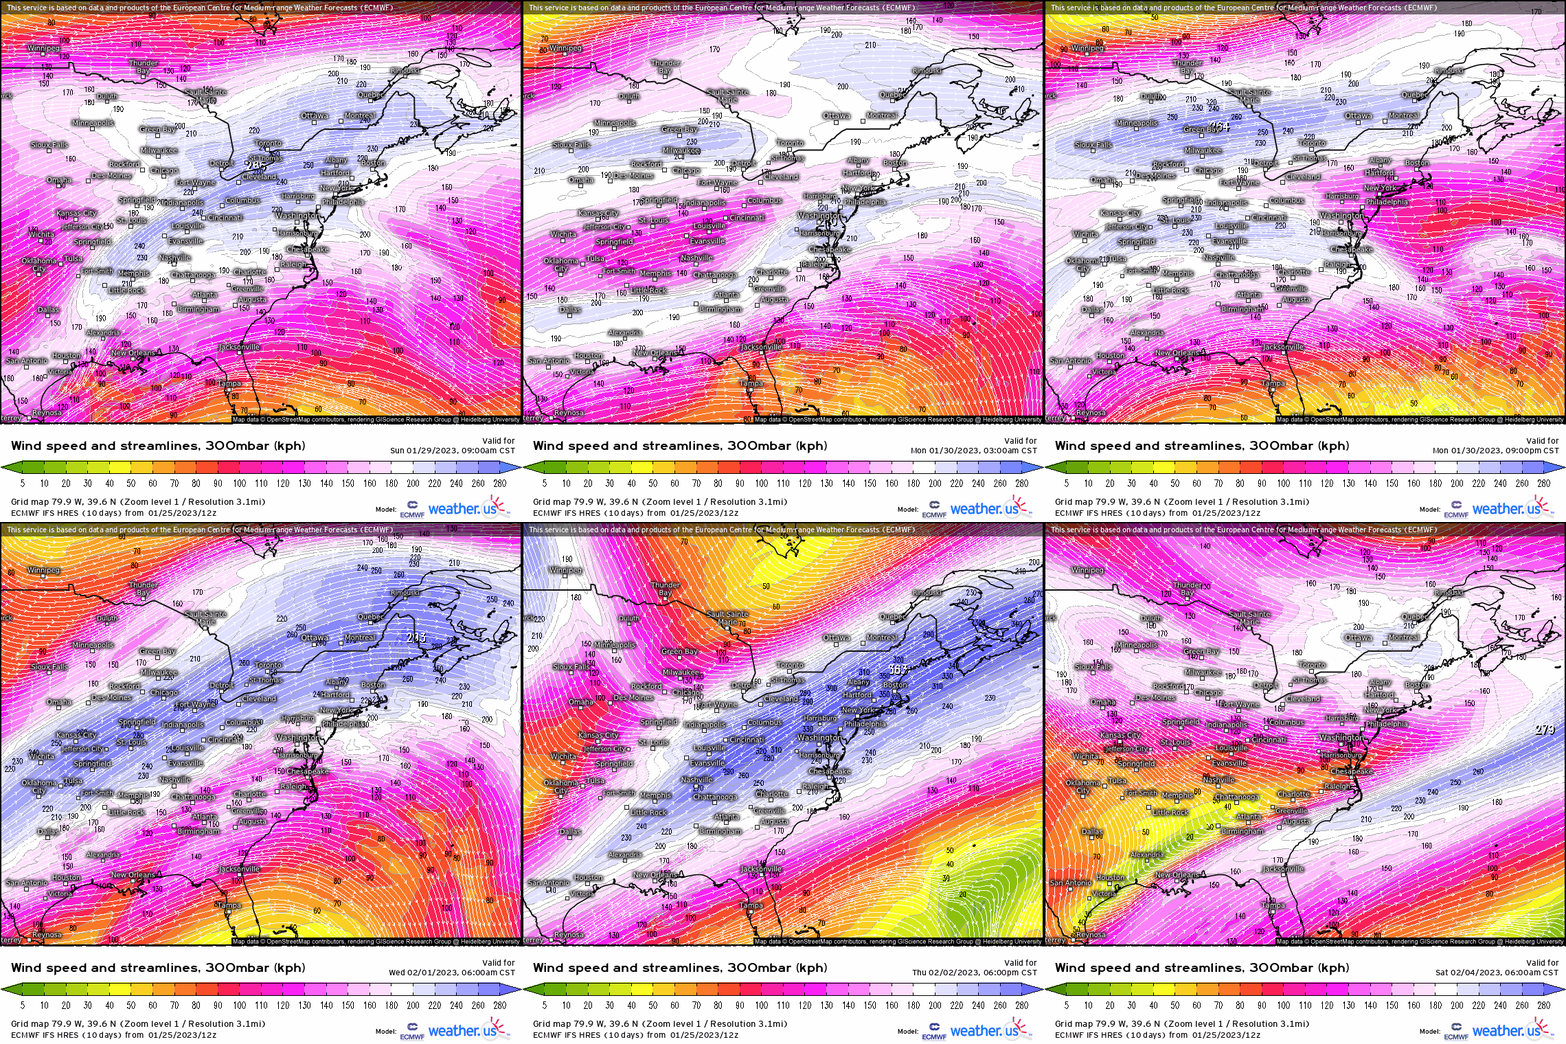
Going up a bit higher now to 300mb, we see the jet stream essentially point where the storms and active pattern will be! Looking further, notice where exactly the jet stream is propagating from …. the Gulf, or to be more specific, the Eastern Pacific. This allows more than sufficient amounts of moisture and latent heat!
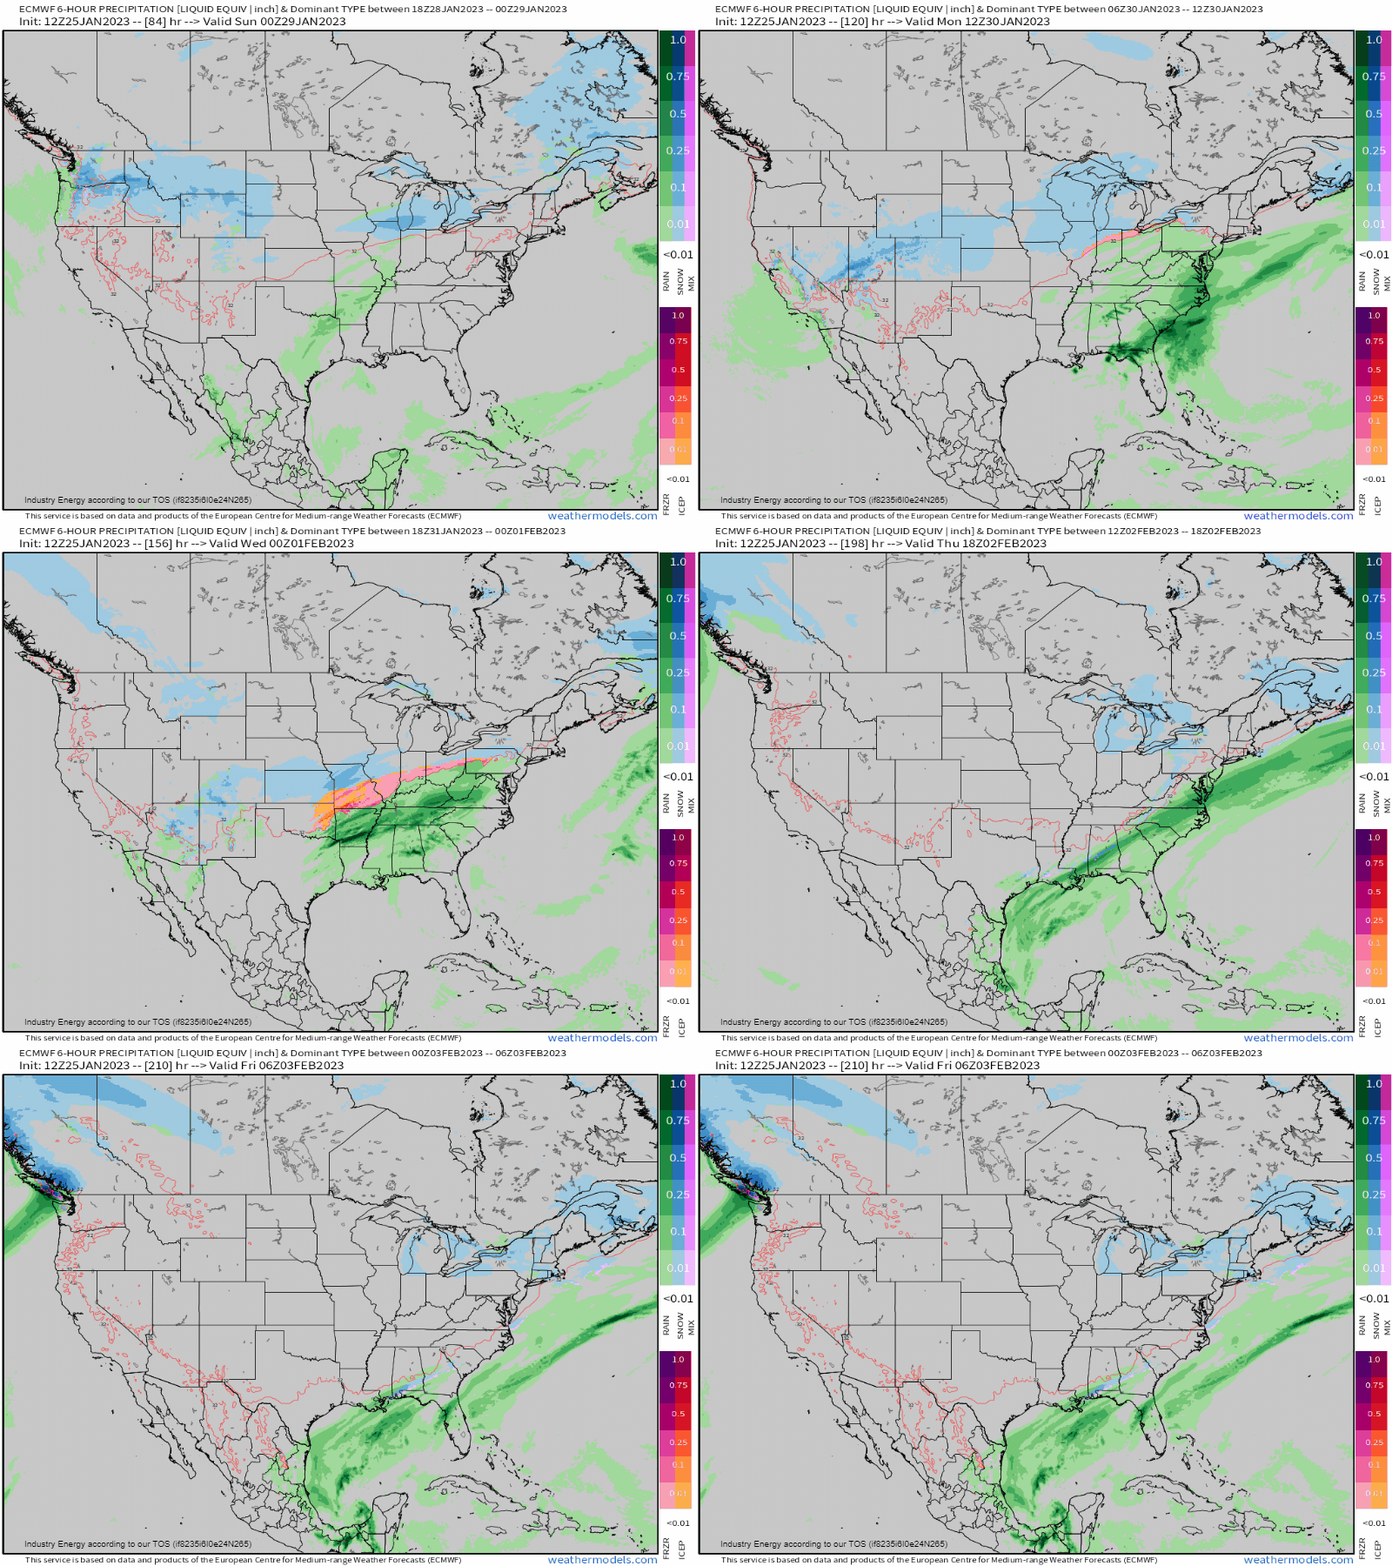
Now, bringing this to the surface, without even looking at any precip-type makes, you could’ve made the assumption of how it’d play out! Unsurprisingly, taking the ECMWF for example, we see several waves emerge from the Deep South that continuously follow a boundary (gradient) into the Northeast. To the north, we’re going to likely be dealing with sleet/freezing rain and a wintry mix with snow further north toward the colder air. Further south of the temperature gradient, as you may have guessed it, heavy rain. Now where this “battle zone” establishes remains to be seen in terms of specifics, but we do know with high confidence that this will occur somewhere between the Great Plains and the Ohio River valley. If the strength of the southeast ridge is stronger, we could expect a more northward shift in wintry weather and vice-versa.
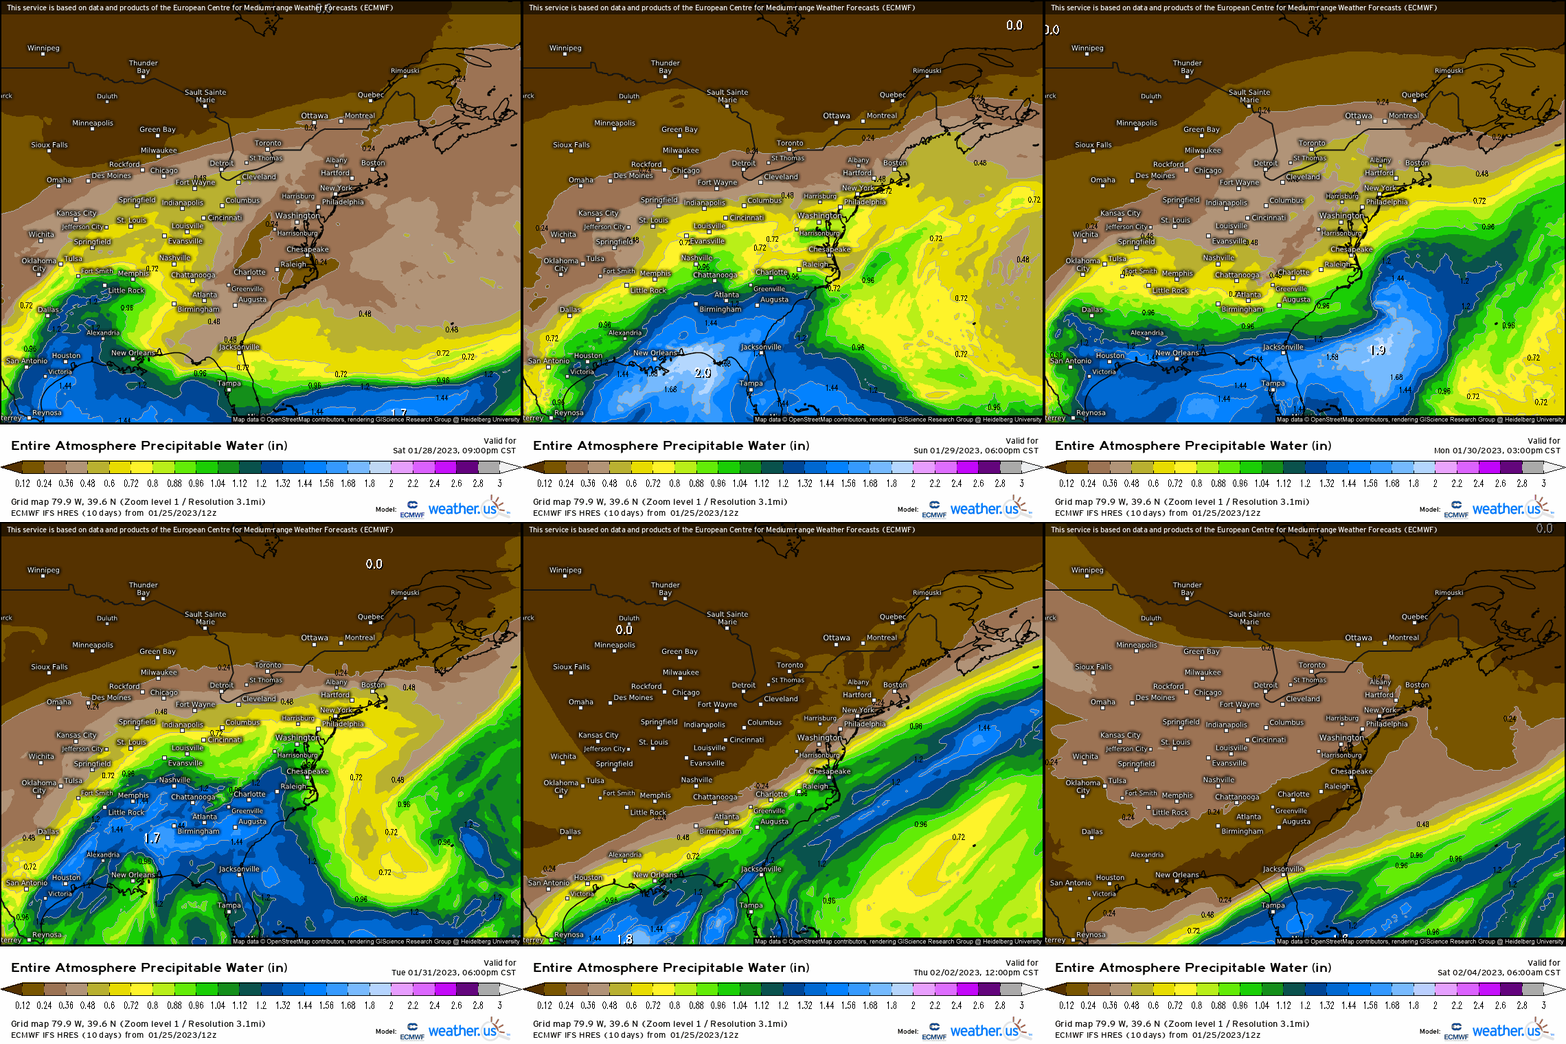
What’s neat is that we can visualize the moisture content and “see” the gradient through water vapor. South of that gradient we have more warmth, therefore, parcels hold more latent heat which water stores massive amounts. On the flip side, we can see the pure lack of water vapor to the north; therefore, that coincides with colder air (as colder air has a much lower saturation vapor pressure and capacity to store “heat” ).
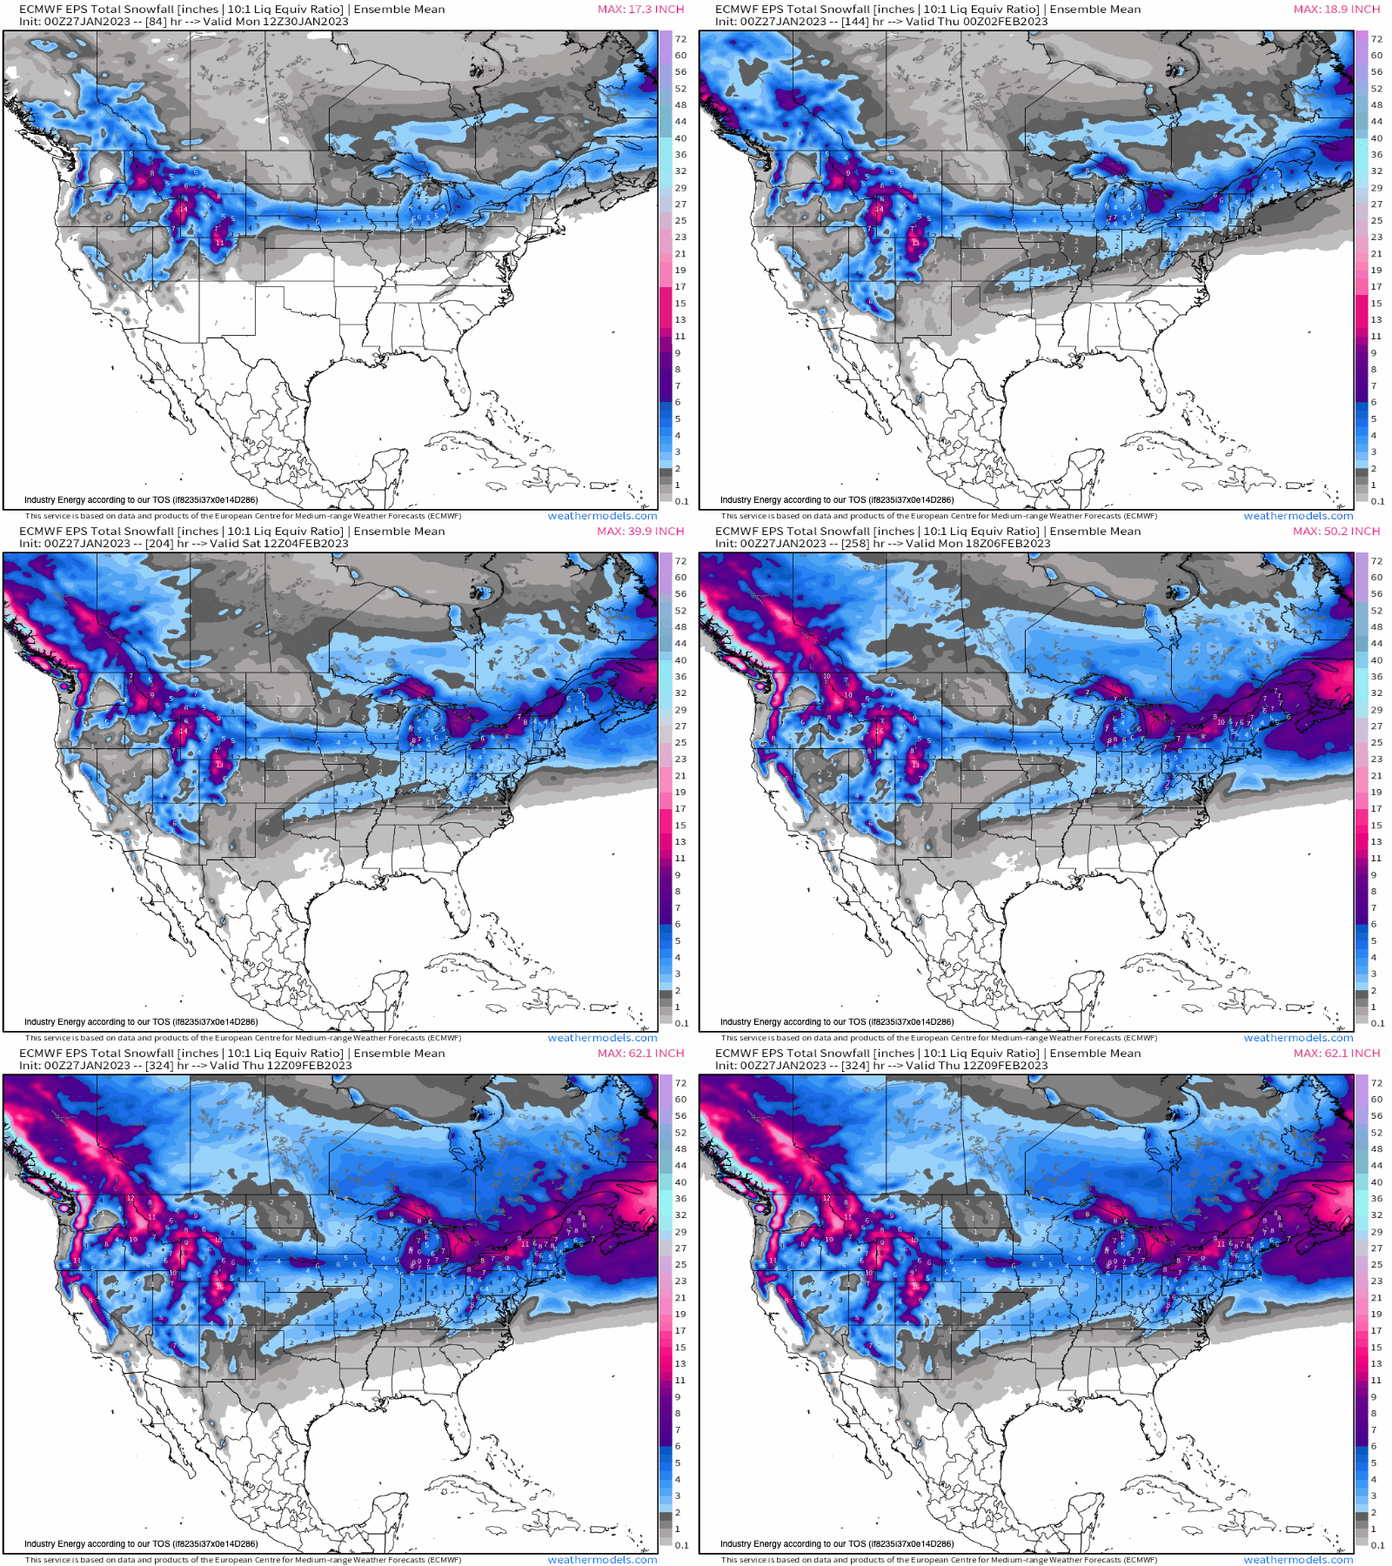
Now in terms of snowfall, since we’re still talking uncertainties here, this is where ensembles come into use and is exploited for its extreme helpfulness in depicting variability. Below is the EPS which outlines where the average of all 51 ensemble members “thinks” accumulated snow will transpire through the end of the first week of February. We see below that an active snow pattern emerges for the Great Lakes and interior Northeast, but do we see snow make it down toward the I-95 corridor? We shall see, but with arctic air now establishing back into North America and with an active storm track within the vicinity, I’d say odds are at its highest of the winter season since we flipped to January!
