A Look Into February: La Nina-ish Would You Say?
Now, I know what you’re thinking – if weather forecasting is as hard as it seems, and it’s by sure one of the hardest feats that a human can do in my opinion, why even bother looking at what the weather could produce in a month??
Well, believe it or not, sometimes long range forecasting a general pattern over a span of weeks can be easier than trying to nail a snowstorm in the day 3 – 5. The only reason I can say this is because there are some things that the atmosphere does, with the usage of analogs and experience, that we can predict! There are large-scale, global circulations that have time and time again, produced very similar patterns. In this case, we’re in a La Nina of course, and this means we see a pattern that develops in the month of February that has been observed for decades in terms of the height pattern.
Another reason I figured to write this type of post is because every 1st of the month, meteorologists and forecasters alike look forward to the seasonal climate model reveal its brand new prognostication for the future! In this case, here is the ECMWF SEAS-5, a very useful and solid climate model. Without even looking at it originally, I schemed an image in my mind of where the general large-scale features were probably hanging around (i.e. ridge/trough). Without any type of shock, I knew it all along. Below, we see the typical La Nina “Southeast Ridge”, with notable expansive positive heights across the deep South and Southeast. Now again, this is a climate model so we’ll see “smoothing” of heights that isn’t captured at a much higher resolution. Then we see the troughiness out across the Pacific Northwest.

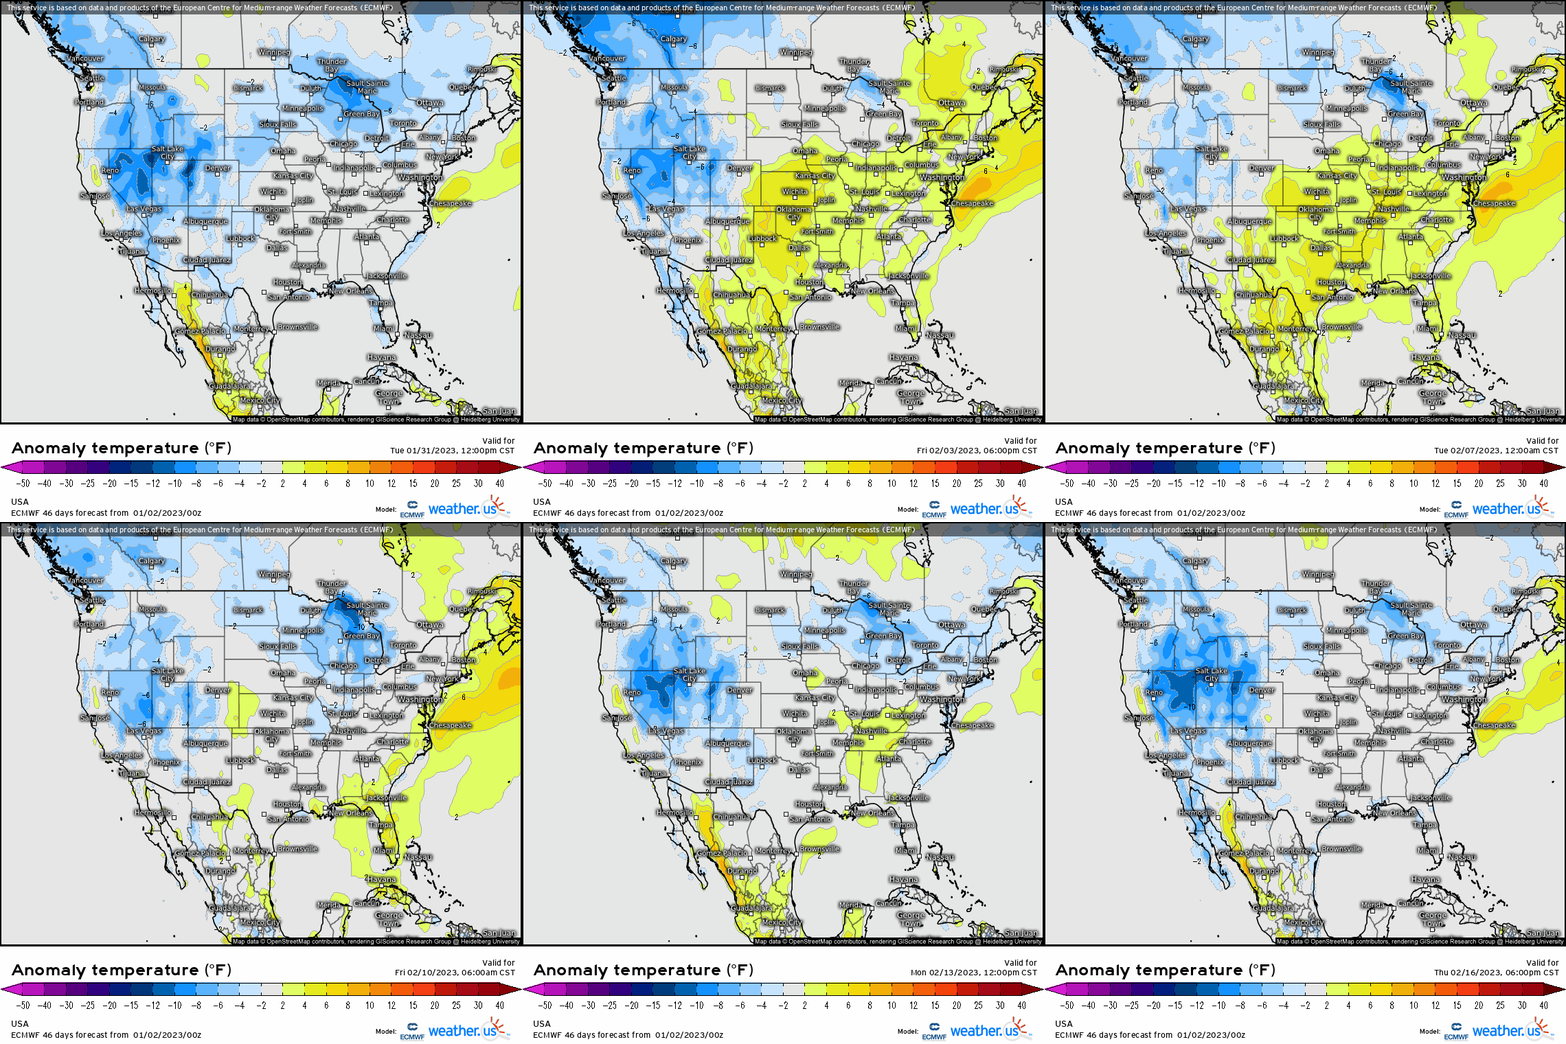
Taking a closer look at the temperature anomalies, we see the footprint of the ridging across the Southeast and east of the Rockies, while below average temperatures confined out in the West, northern Plains, and Pacific NW. Again, this goes to show that climate models, with the help of analogs and general knowledge of macroscale atmospheric processes, that certain long range forecasts can be made with higher-than-normal confidence.
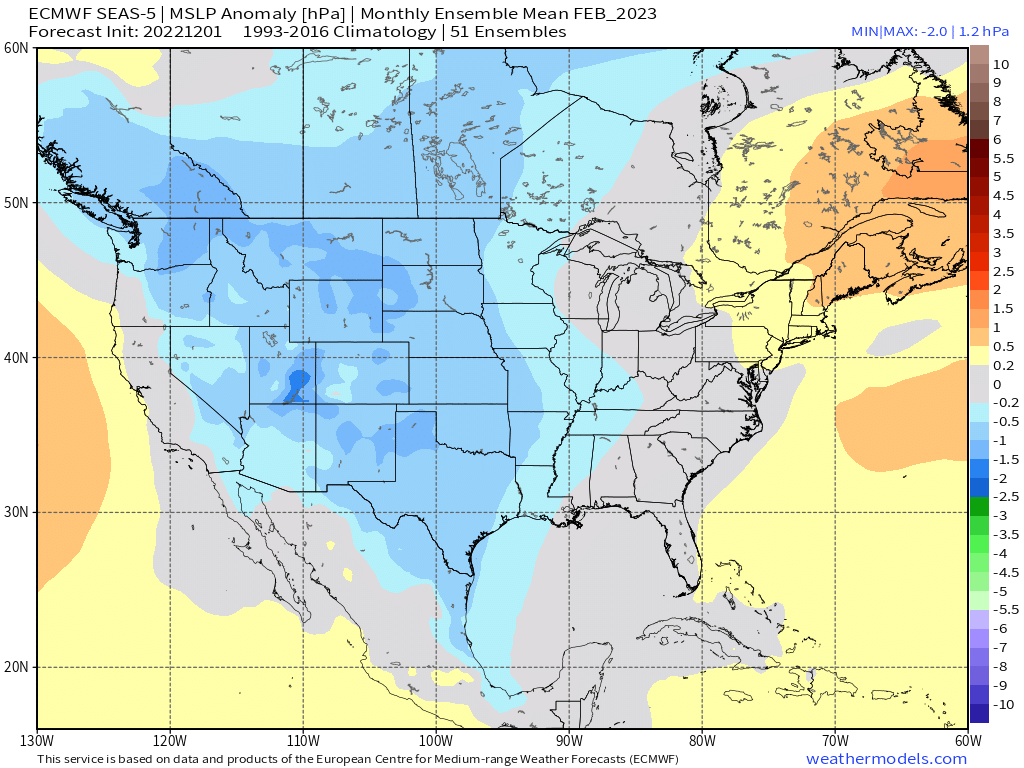
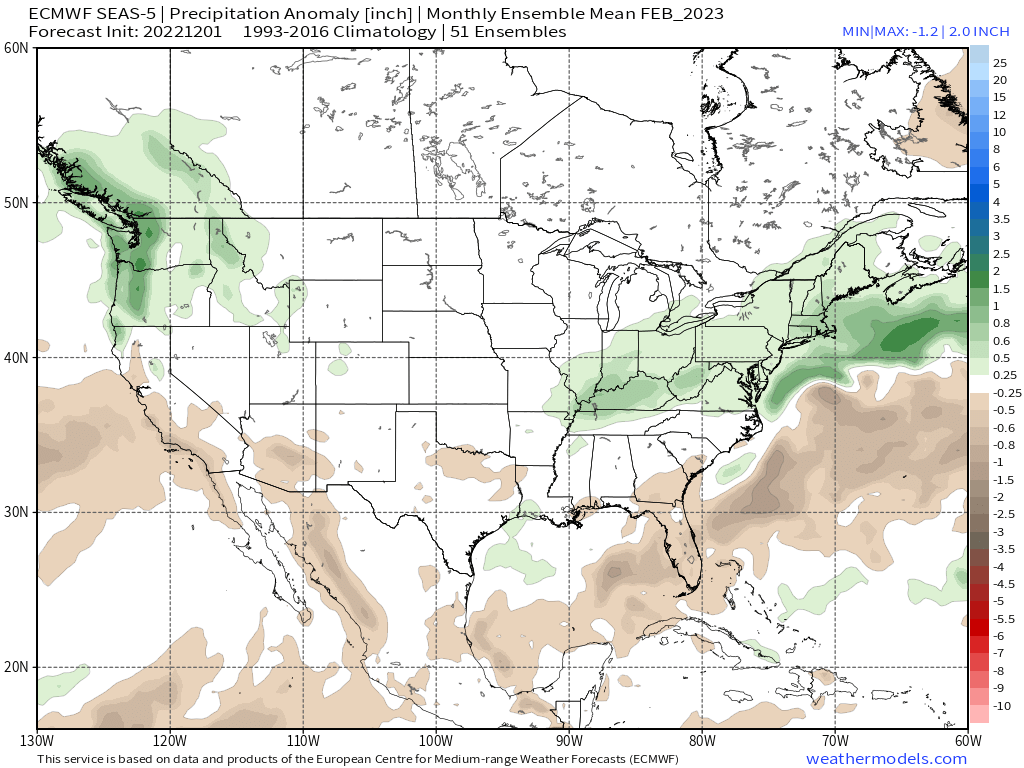
Below we see the general sea level pressure anomalies, along with the outline of the % of precipitation. Not surprisingly, we see below average pressure out West with higher pressure’s in the Northeast and along the East. Interestingly enough, this is also a pattern that the storm track remains active in between the Pacific/West trough and Southeast ridge, where you tend to get overrunning precipitation events (i.e. cold air wedged in the Northeast, getting rain to snow or wintry mix), and cold air damming type events in the Mid-Atlantic/Northeast.
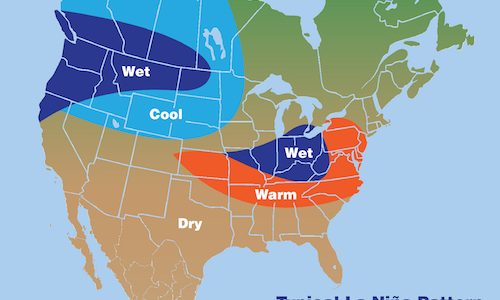
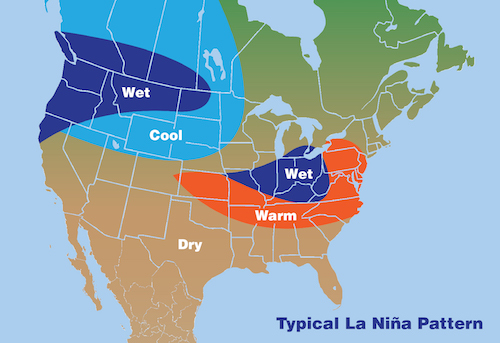
From NOAA , a nice article is written to help elucidate how large-scale patterns that involve the Pacific basin that “couple” to the atmosphere produce certain patterns. Well not unsurprisingly, you’ll notice this general simplistic sketch of the sensible pattern awfully resembles that of which has been shown above!
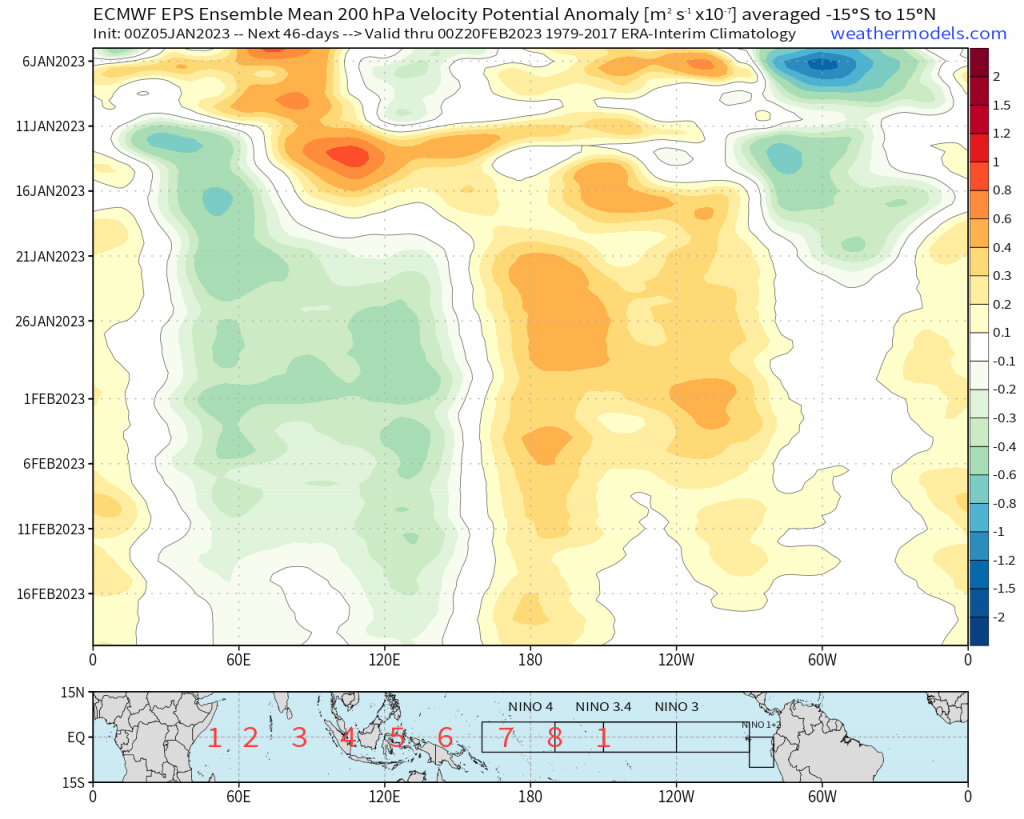
Lastly, utilizing the hovmoller (we all love these!), notice the expansive area of blues that is concentrated between ~60E and ~ 150E? This is what we’d consider a typically Nina pattern where convection, or upper divergence (green/blue) likes to linger given the warm SST’s surrounding the Maritime Continent. This has a big downstream effect, by causing the jet stream to continue to “crash” into the West and keeping the Aleutian low nearby, so troughiness hangs out in the Pacific NW while the jet lifts east of the Rockies, thereby allowing milder risks. We also could even see some more severe weather setups given the trough-ridge pattern. Now i’m getting ahead of myself, but this also does not mean whatsoever we can see a “pattern within a pattern”, where we see a ridge out west, and trough in the east. We’re likely to see that happen, and even could see large snowstorms in the Northeast because we simply can’t predict exact details this far out. I figured I’d introduce the brand new outlook for next month using the climate model which is the SEAS-5, and explain why it has merit! Now, I didn’t explain how this could be totally wrong. While there are some “easy” aspects to it, it’s harder to see other unforeseen processes like what if a shakeup to the troposphere occurs and disrupts the strong polar vortex? This could theoretically throw a wrench as long range forecasting usually does. I will say, however, while there’s a large area of below average snowfall, it’s still winter for another two and a half months and still plenty of it left!
