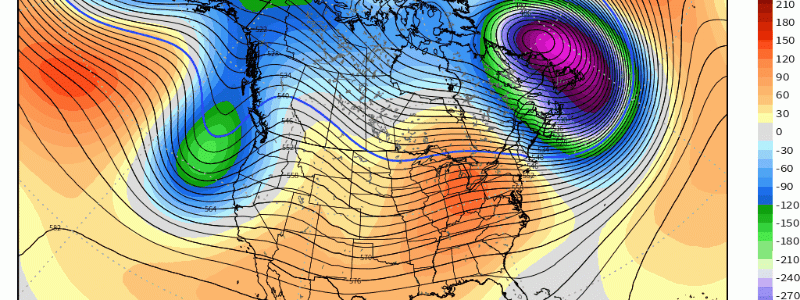
A Look Heading into February … Plus Some Insight In Using the MJO For Forecasting.
Once again, it’s that time to look into medium-long range as we open up a new month as January quickly flew by! As i’ve stated in previous longer range forecasting blogs, there are certain signals that forecasters analyze that render higher confidence in certain pattern configurations. Instead of using a hovmoller, here we are using to identify velocity potential by irrotational wind vectors. In essence, it really is used to display where there is upper-level divergence (blue/green) and convergence (orange/yellow).
This is shown through a 5-day interval, and what I want to point out in particular is the robust divergence occurring across the eastern Indian Ocean and into the Maritime Continent. This progression happens through mid-month. This type of wave-pattern configuration teleconnects to ridging in the East and troughiness in the West.

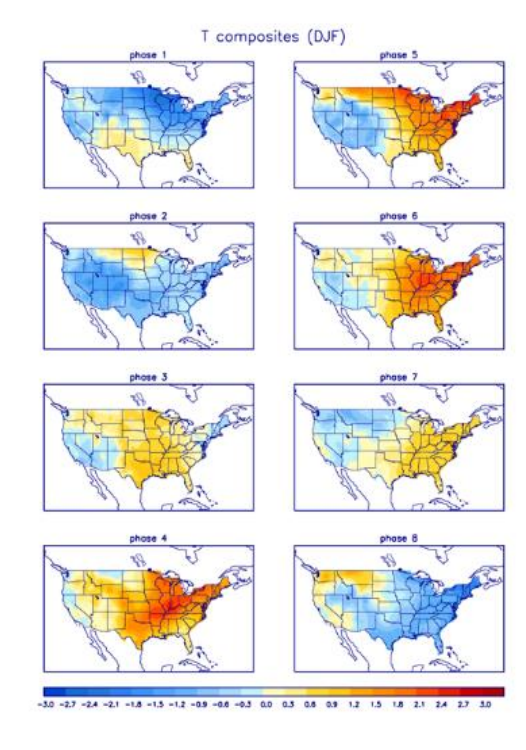
What do I mean by teleconnecting to the N.A. pattern is that the MJO – a coherent one at best – influences our pattern when all else is equal through dynamic processes that stem from the tropics out in the Pacific (along the Equator more so). In a very simplistic case, here we see 8 composites that are associated with the MJO phases . When convection arises along the equator, or in other words the actual MJO wave, we try to quantify in what generic longitude thunderstorms (convection!) are taking place (i.e. Indian Ocean or along the international dateline). If you know where the general phases are through the years, or click the hyperlink (“MJO phases”), you’d then match up where the upper-level divergence is taking place (above). From there, pinpoint what phase we’re in, and then lastly look below. These are once again, 8 composites that have revealed over time what type of temperature pattern occurs with a specific phase. You’ll note that what we’re going to see transpire is a “tour” through phases 3-6, give-or-take. These phases as shown via CPC , reveal above average east of the Mississippi. Let me just emphasize this point: This is a very direct, simplistic explanation in how we can more or less rely on utilizing these composites as you probably know by now that the atmosphere is just a wee bit chaotic… truthfully we really never have a linear 1:1 relationship; however, as stated and explained, through governing research and case studies has this proved to be pretty darn reliable (at times) in helping medium/long range forecasting.
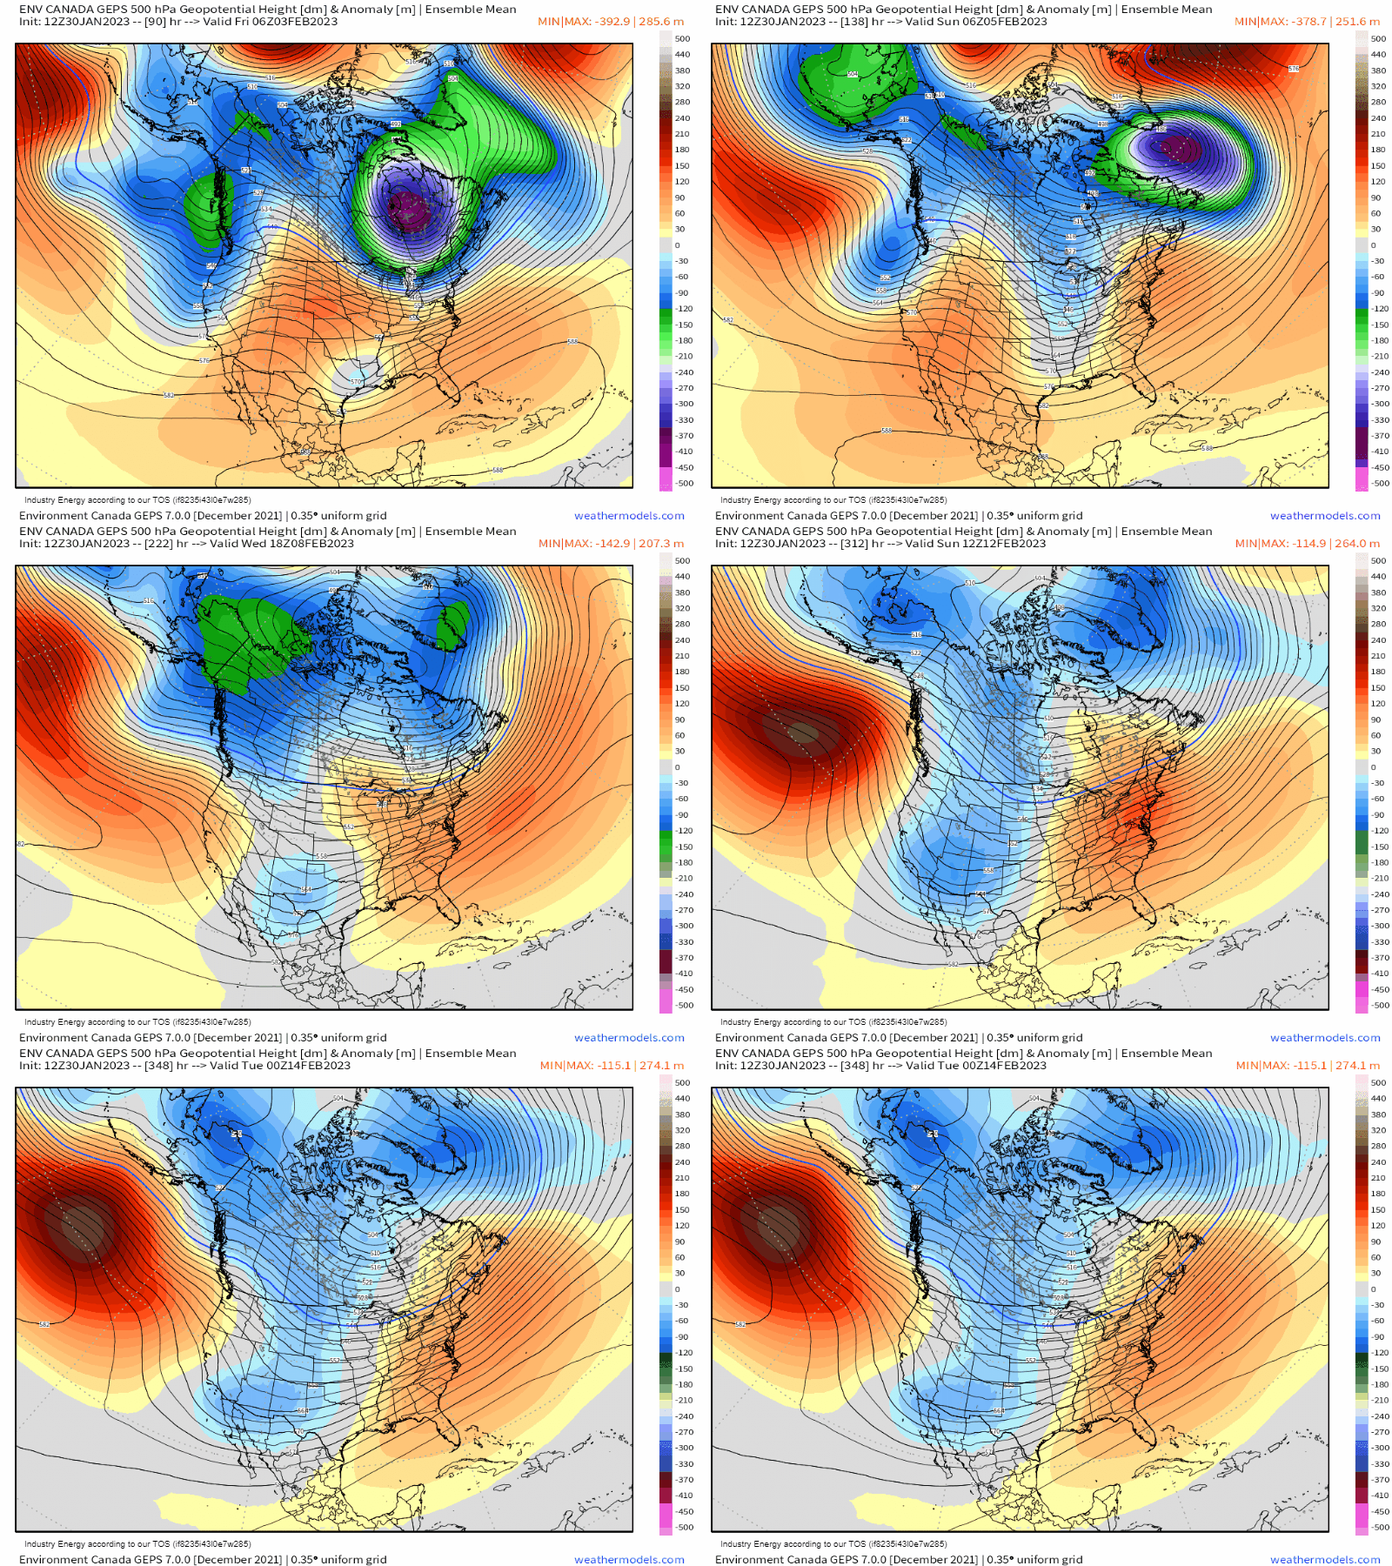
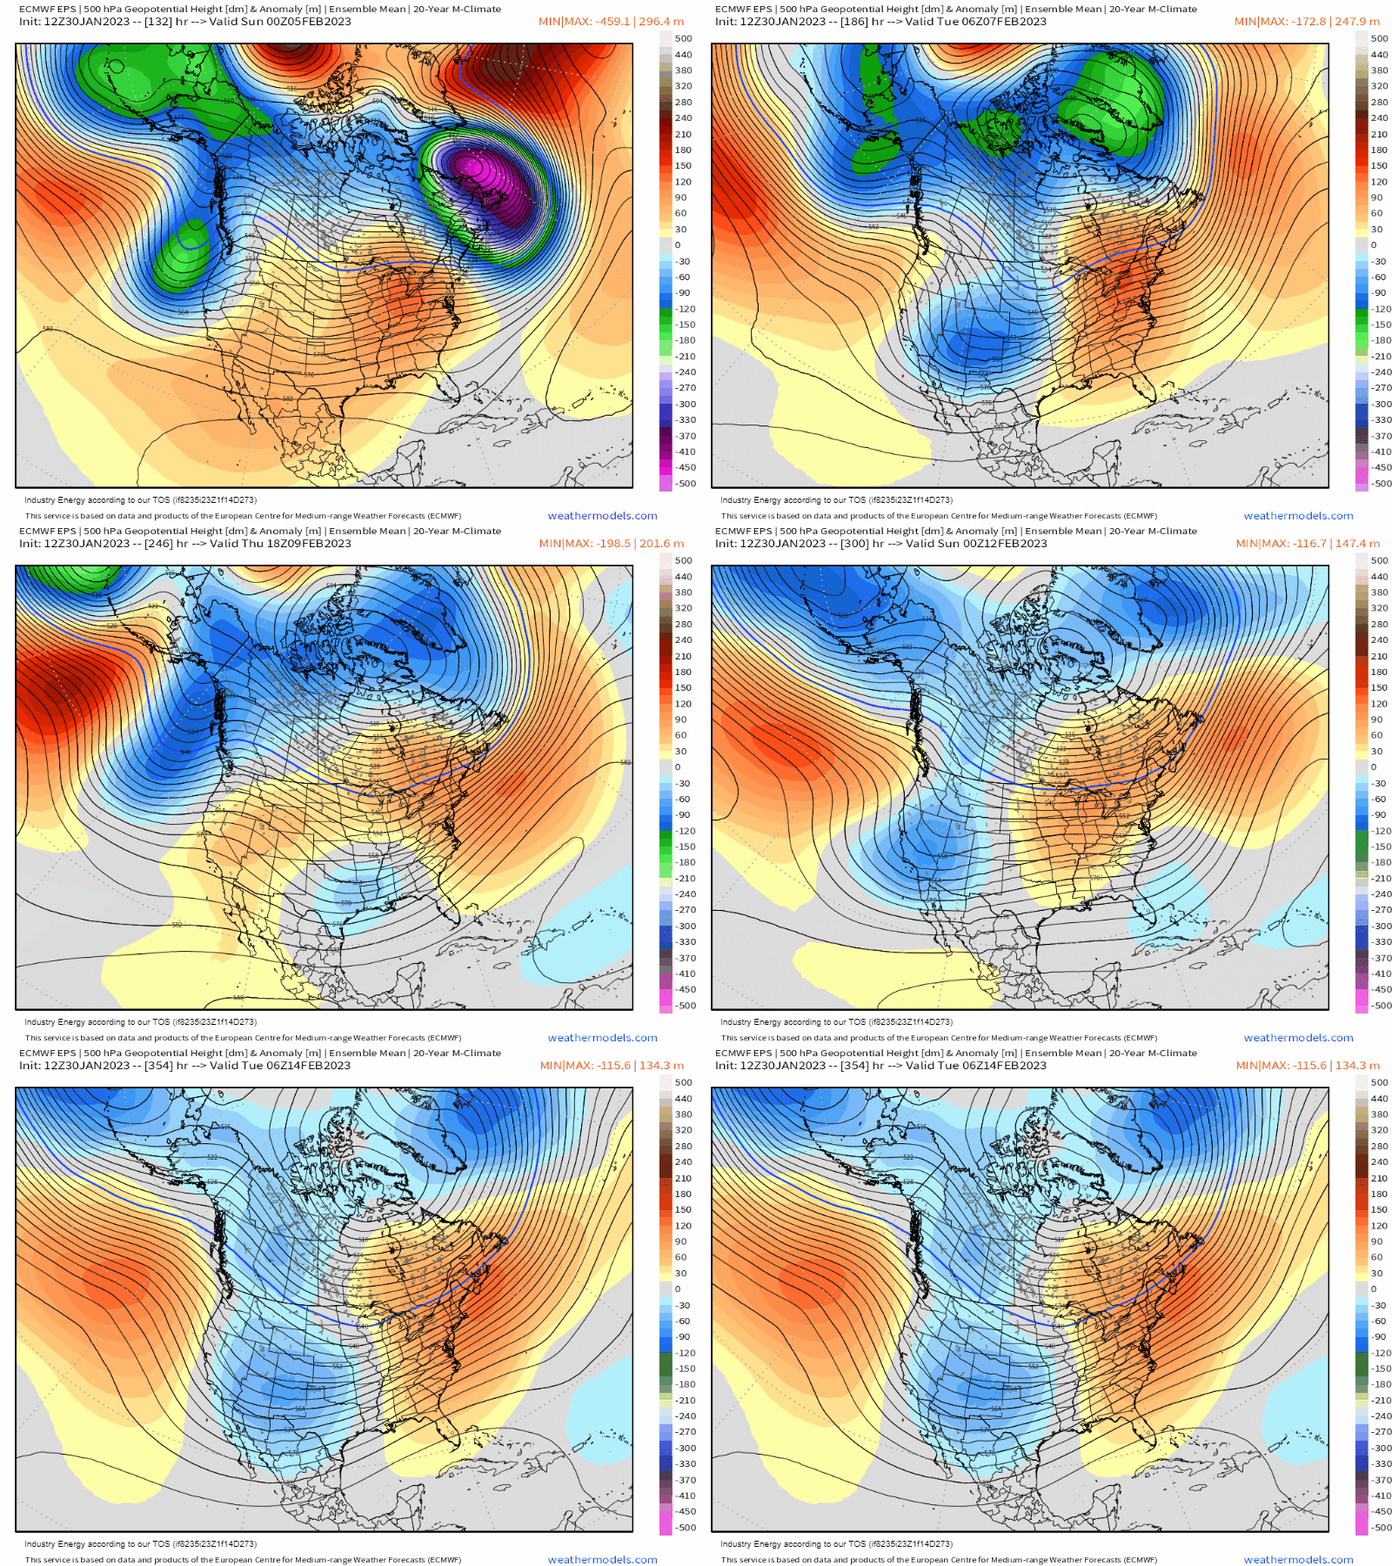
Okay, so what about numerical weather models? Alas, lets look at what the ensembles are showing (EPS, GEPS). Soon after the TPV (tropospheric polar vortex) departs the New England area, we see a quick mid-level synoptic progression to below average heights evolving into the West, with above average heights building in the East. The north Pacific ridge gets shunted southward becoming more zonal-esque upstream, and now Pacific maritime air can once again filter in. The arctic air fully makes a retreat, and we go to a classic canonical la nina-esque pattern with southeastern ridging, and an active West coast.
Digging into the surface temperature departures that carry us through mid month, and we see unsurprisingly that the above z500mb pattern juxtaposes nicely with the surface. The core of the below average temperatures remain out West, while average to above average temperatures manifest across the Midwest and into the East especially.
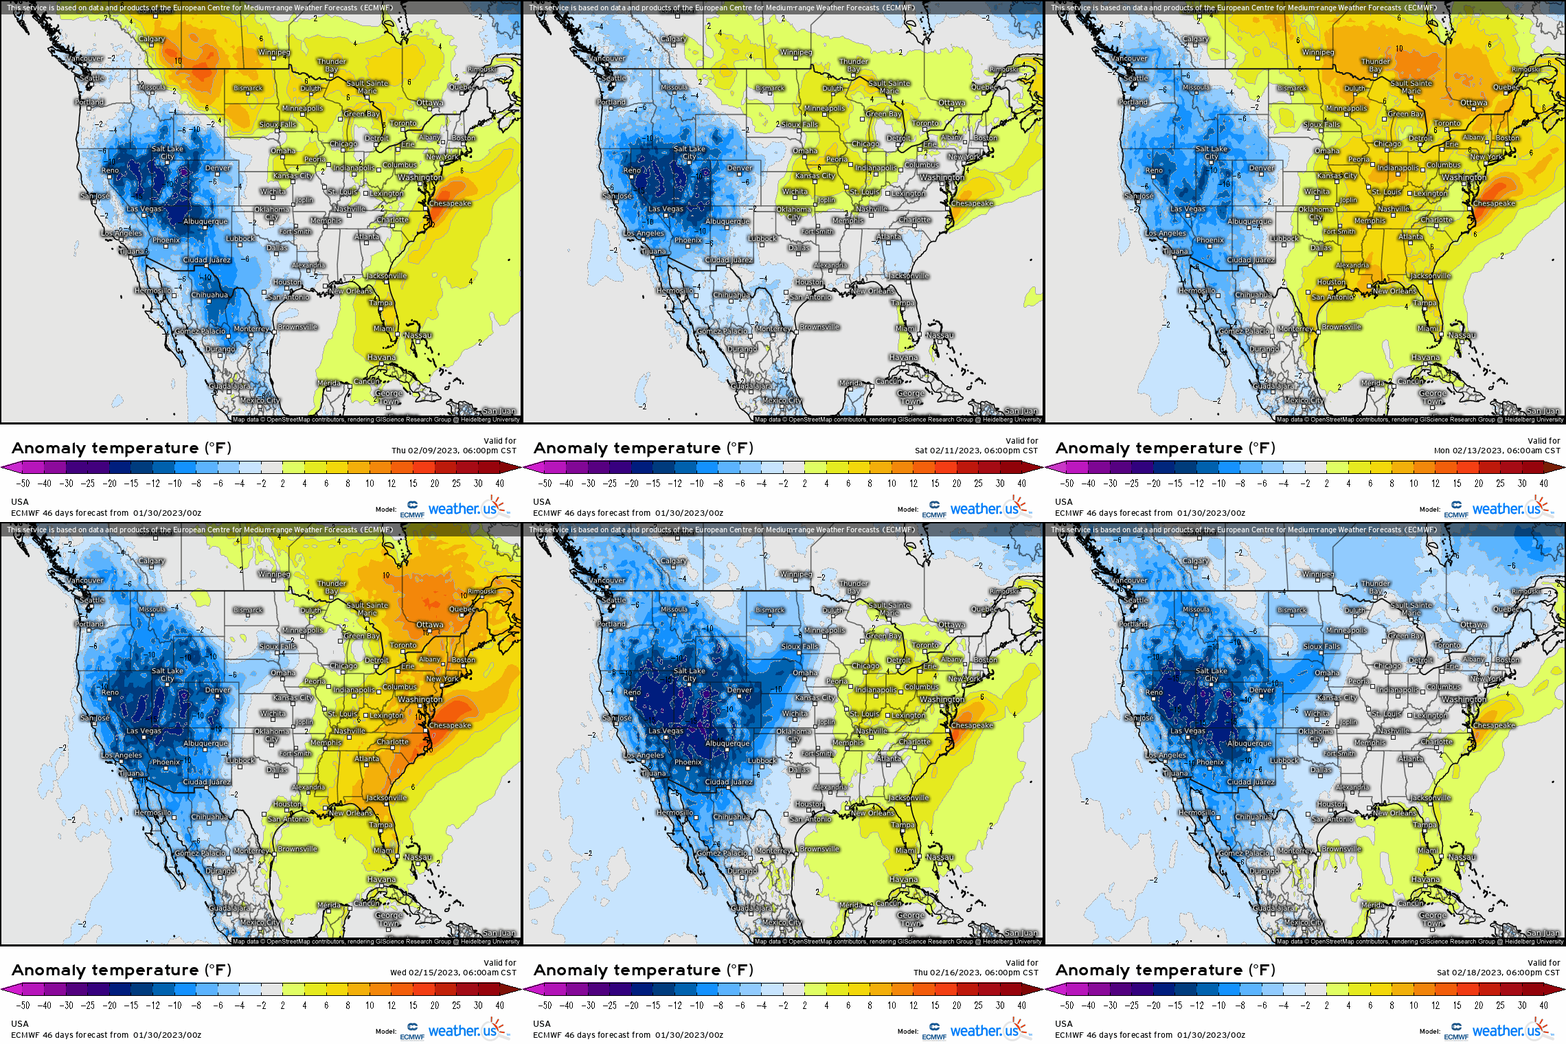
This pattern progression has pretty solid support with emerging signals that also give credence to what ensembles are showing in terms of temperature departures. Once again, we’re going to be dealing with most of the action regarding wintry precipitation to remain west where it’s been dominant all winter long, with not much wintry action on the opposite side of the coast. Could there be a “sneaky event” in the East? Sure! Climatologically speaking, we’ve reached the snowiest month for many locations across the U.S. Nonetheless, this does take us into around mid month, but we shall see what the second half of the month has in store as there are some indications we see a reversal to an extent. As I like to say though, we’ll certainly cross that bridge once we get there. For those who dislike winter in general, i’m sure you’ll be happy to read this! Believe it or not, but solar spring officially arrives this Saturday…. Spring is not to far behind!
