A Look Back On 2022’s Weather Extremes – Flooding & Heat
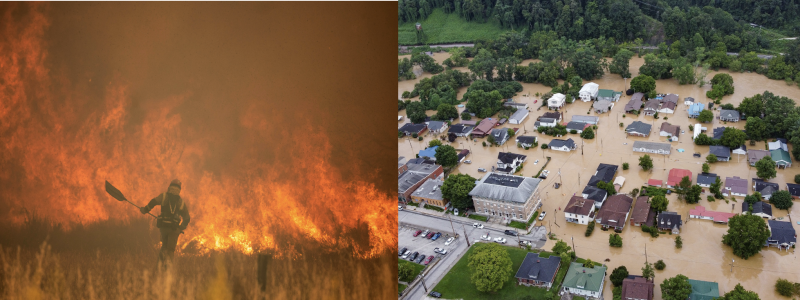
Well, here we are at the end of the year. It has certainly flown by, which I feel like I say to myself a lot and think many would concur! A good amount of weather events transpired this year, but a few stood out and that is what will be covered.
While we won’t be able to cover every single event of course, and some events did have considerable impacts, several however did leave its footprint in the history books. We’re going to cover flooding and heat events, as Meghan will cover severe weather and the tropics in her blog.
Extreme Heat
Let’s first begin with an excellent graphic (Link) that captures where the anomalous ridging, and heat records or days of excessive warmth this year. Below, there are several regions that we can discuss; the West Coast (Pacific NW & SW), Plains (Midwest), and the South.

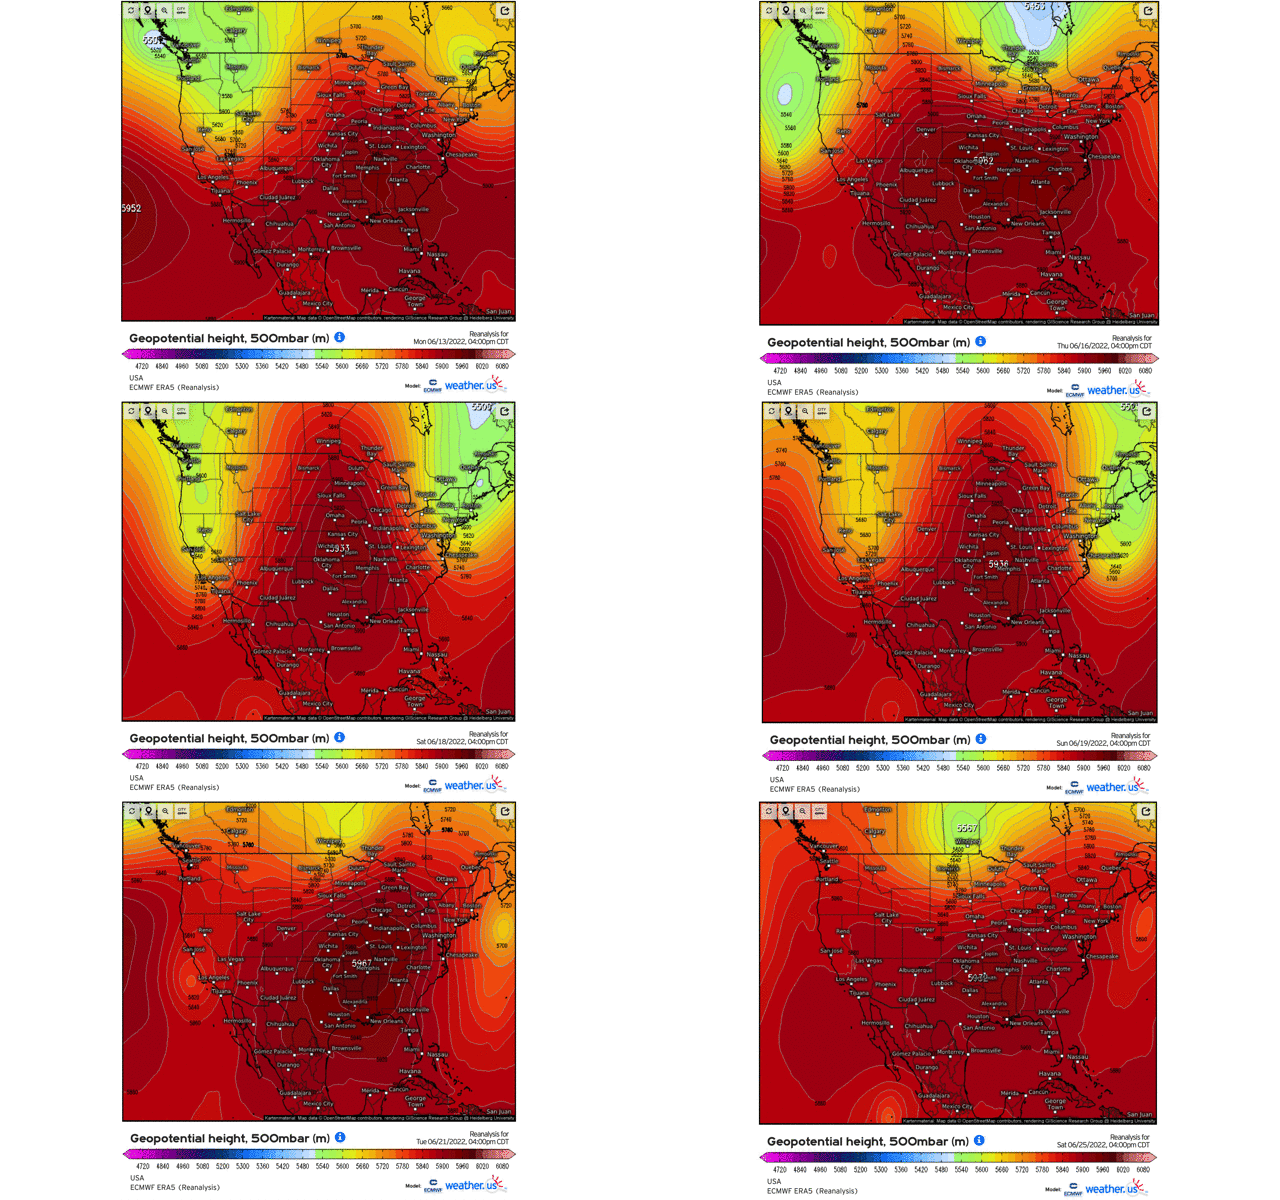
In June, a record-breaking early season heatwave brought historic values to parts of the Southeast and Midwest. An anomalous ridge billowed and intensified by the 2nd week of June, where heights increased over the course of a few days to nearly 600 decameters, making for a very intense ridge! We can see the migration and stagnation of the ridge first start across the Southeast, and then slowly retracts and expands before edging back again Eastward. It finally lessens in magnitude by the end of the month. This ridge also worsened drought conditions across the Deep South and Southeast. This ridge alone caused multiple days of heat indices over 105*F, with places like St. Louis hitting 100*F, breaking the daily record in conjunction with 4 consecutive days of lows not reaching below 81*F. Chicago saw consecutive days of temperatures exceeding 100*F, while Minneapolis recorded its first triple digit in 4 years along with places like Mobile, Alabama recording its earliest 100*F reading in June. Not to mention, over 125 million people were under excessive heat warnings, which we don’t see that type of stat until later in the summer season! Florida, Louisiana and Mississippi recorded their top 10 warmest Junes on record and Texas recorded its 5th on record. Also, Lake Mead hit their lowest point on record thanks to drought conditions worsening via ridging!
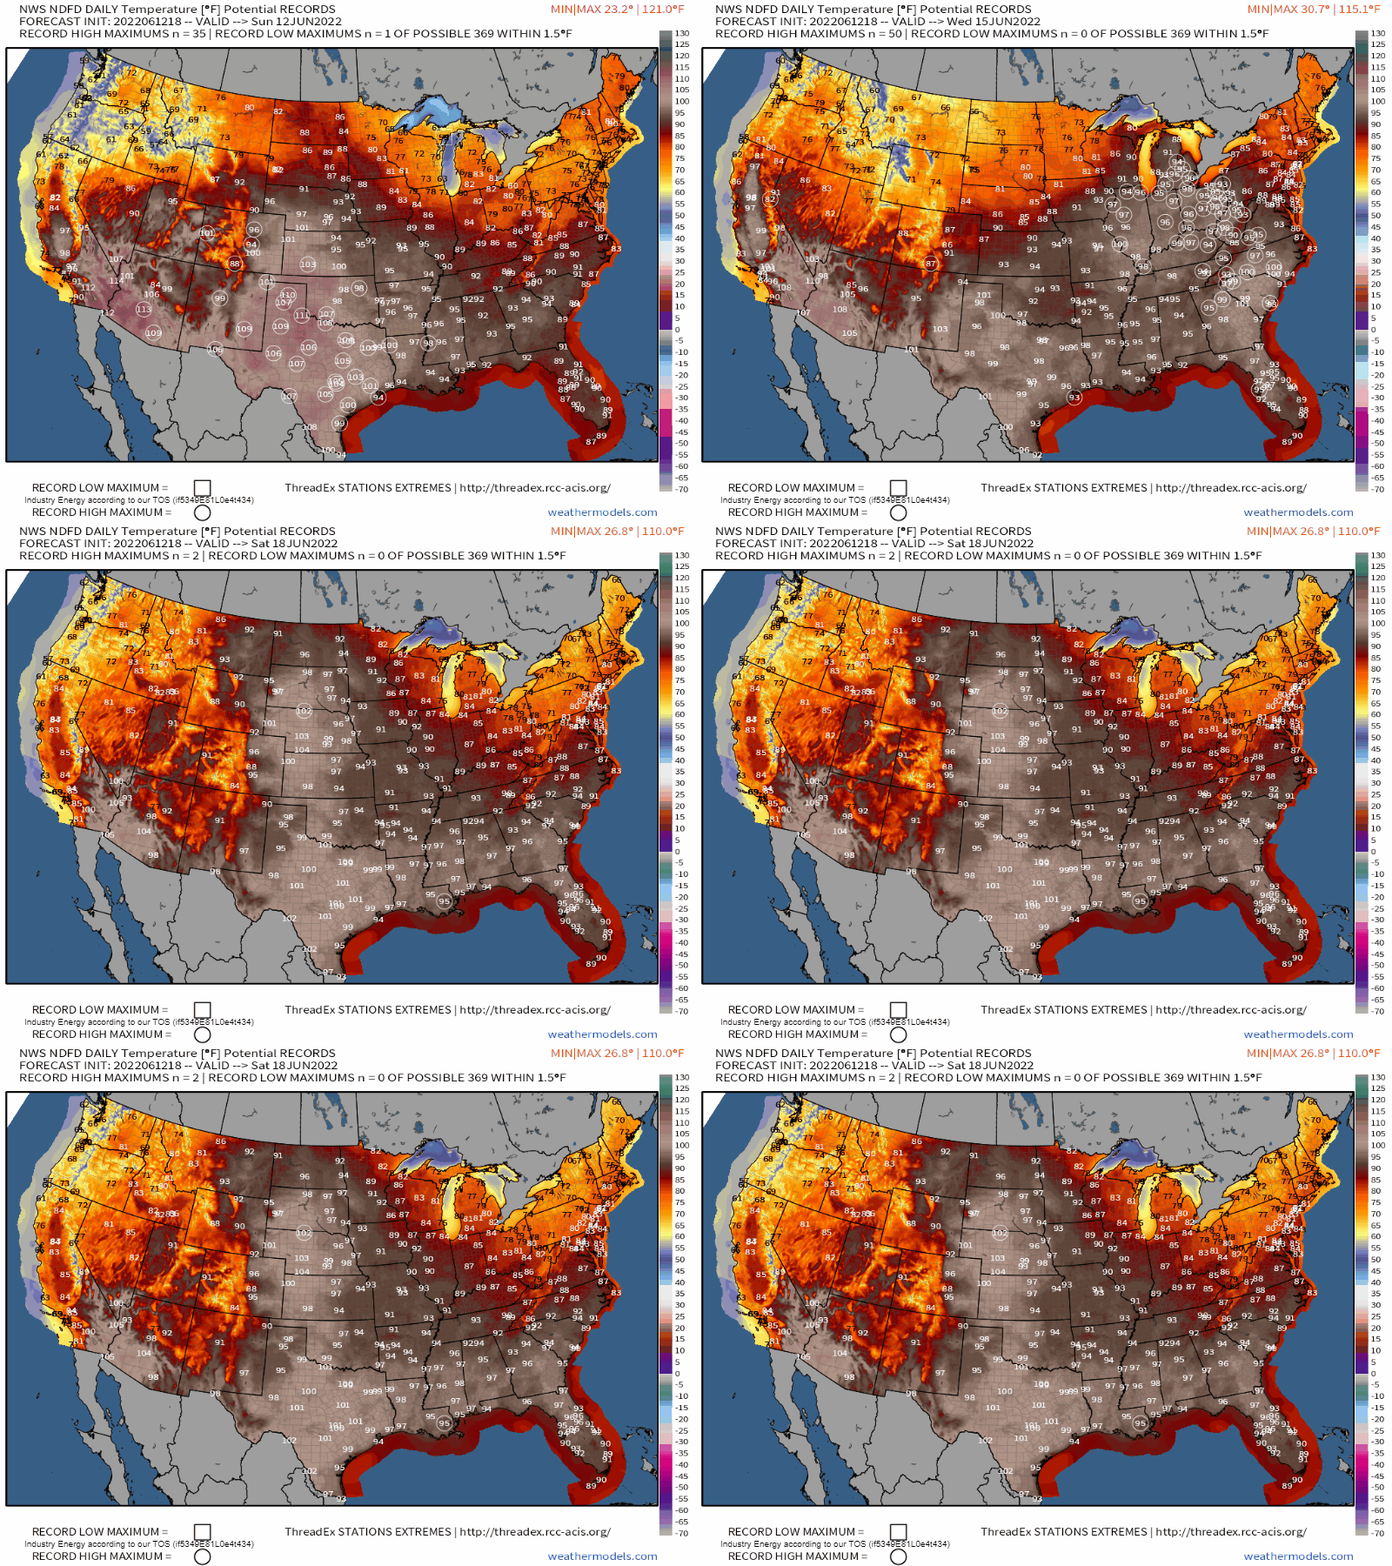
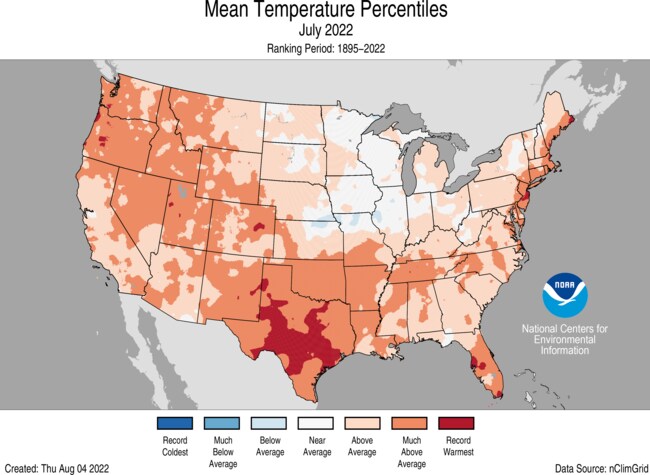
As we turned the calendar to July, we saw another more potent heatwave grip the Deep South and the Pacific NW that smashed dozens of U.S. daily high’s records. According to NOAA, July featured its 3rd hottest month on record regarding the mean average temperature.
Yet again, a +597dm ridge built in, but this time remained stationary across the Deep South before slowly shifting westward as then the Bermuda ridge facilitated heat across the SE and up the Eastern Seaboard.
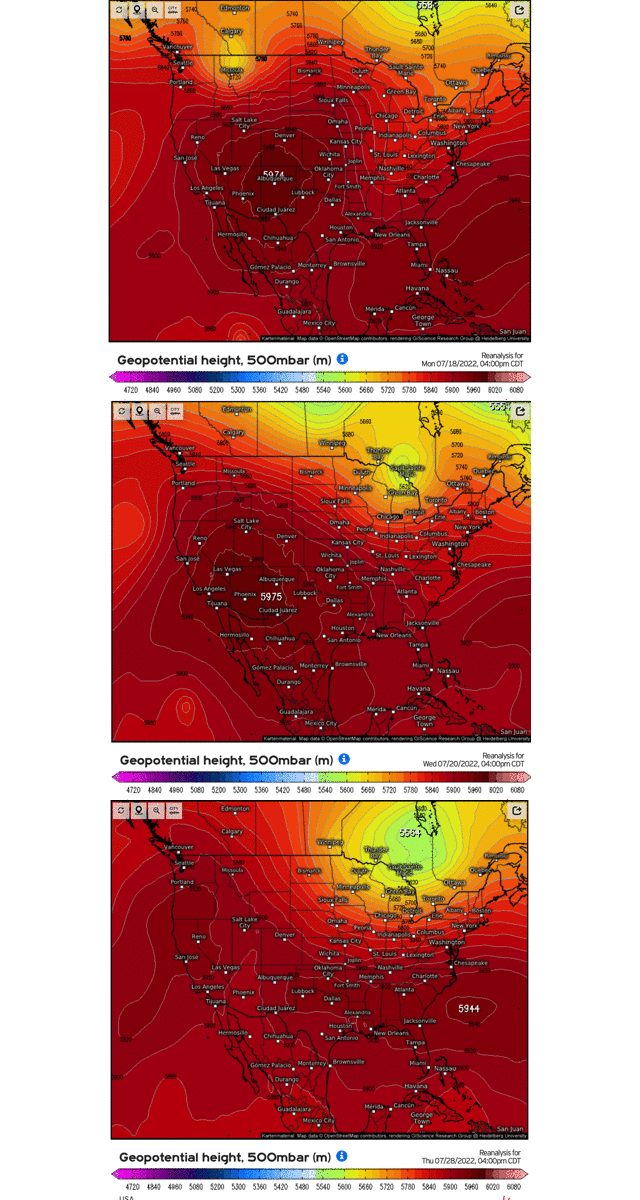
What made July very unique in terms of relentless heat, was that the average low temperature of near 63*F across the entire country was the warmest since official record-keeping began in 1880! Colorado, New Mexico, Texas and Tennessee out of several other states saw their nights rank among the top 10 warmest.
One remarkable stat especially for Texas, as they were one of the states that experienced several smashed records and recorded several headlines is that the statewide average for daily highs in Texas averaged 100*F, topping the infamous heatwave from 1980. A remarkable 24 out of 31 nights set record warm low temperatures as in the last 13 days of the month, the temperature never dipped below 84*F! Out across the Pacific NW (what else is new!), Seattle smashed daily high’s with a new record for the longest heat wave in city history by recording 6 consecutive days with a daily high temperature over 90*F, and Portland, OR recorded 7 consecutive days of over 95*F. Adding to cities, Salt Lake City and San Antonio saw their warmest July on record based on average temperature.
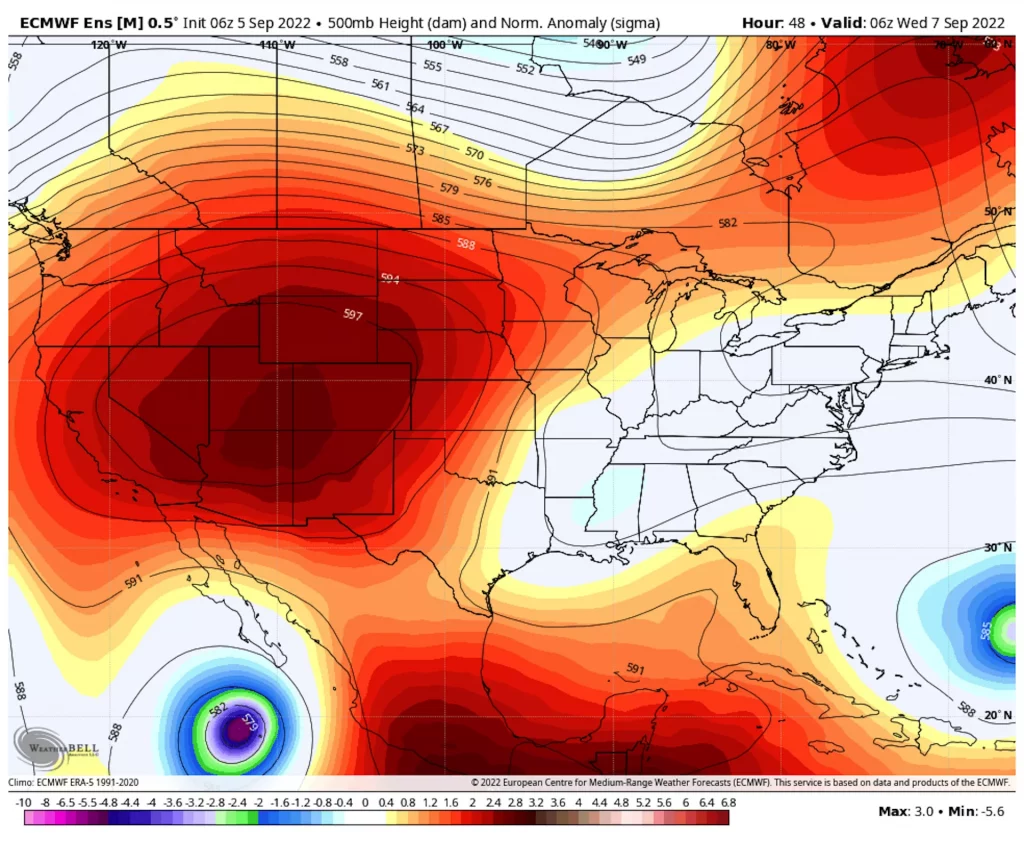
Of the most notable heatwaves and extreme heat, however, stood out out from the previous months and that took place in September. A +600dm ridge manifested, breaking the height records out across the Intermountain West and West Coast, not to mention what the daily surface temperatures were!
We started off with a “bang” on September 1st starting in Death Valley, CA where they set an all-time historic daily record of 127*F – the hottest day ever for the month of September globally! This was in response to another anomalous ridge, or “heat dome”, establishing a heatwave that ended up smashing almost 1,000 records on September 9th out west! Some notable records happened the first full week of September including: 116*F recorded in Sacramento, along with San Francisco hitting just shy of 100*F (breaking their single daily record). California suffered a great deal to their electrical grid of the energy demand that was recorded during the 1st week of September to the point of an “Energy Emergency Alert” that was issued during this stretch. Not to mention, the NWS out of Sacramento coined this heatwave as “record-setting, both in magnitude and duration.” Can’t forget Salt Lake City clocking in at 103*F all on the same day, resulting in 10 consecutive days of 100*F. Nevada and Utah recorded their warmest September ever. Many other locations either tied their all-time records or were broken in other locations out West as well that would be too much to put here. This anomalous ridge also exacerbated wildfire risks out west in conjunction with worsening drought conditions. It was a rough summer to say the least out west, and many locations suffered from the stifling heat across the continuous U.S.
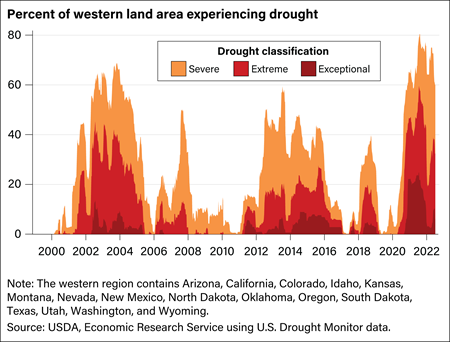
Speaking of exceptional droughts, according to the USDM‘s time series graphic of droughts classified as level 2 or higher (“severe” level 2, “extreme” level 3, and “exceptional” level 4 ), we’ve seen a significant exacerbation since the beginning of the 21st century. Especially since the beginning of the most recent decade, as last year’s drought rolled over into this past year (spring into early fall) for West, Great Plains Intermountain West, and the Southwest.
Flooding Events & Extremes
Let’s begin this segment with this unbelievable statistic:
The U.S. saw an 11-day period where it recorded at least 4, 1/1000 year (0.1% of happening in any given year) flooding events that included Death Valley, Kentucky, Illinois, and St. Louis.
Death Valley 1/1000 Year Flash Flooding Event
On August 5, a monitoring station in Death Valley recorded 1.7 inches of rain. This was the greatest one day daily rainfall record since record-keeping there. What makes this such an anomalous event, is that the amount of rainfall received is over 3/4 of the average yearly total of 2.2”, which happened over a span of a few hours! We can see via ECMWF ERA5 reanalysis of the hourly rainfall rates leading to the flash flooding.

The flash-flooding left hundreds of people stranded in the national park, causing people to strand their cars and evacuate the hazardous situation. This made several main roads and highways impassable for about a month thereafter.
St. Louis Metro 1/1000 Year Event July 25th – 26th
Between the evening of the 25th and into the 26th, relentless training thunderstorms expanded across the metro area, as a result of a stationary boundary and excessive low level moisture via LLJ aligned parallel with the boundary. This type of synoptic setup supports continuous rainfall as the winds are aligned parallel within the first several thousand feet in the lower atmosphere, in conjunction with upper level divergence from the upper level jet all rendered the ideal recipe for immense flooding. You can see this below via integrated vapor transport (shows % of available and potent water vapor between a depth) and how values of over 600% of average existed during a span of a few days! This combination supported rainfall rates that exceeded over 2”/hr. A remarkable 9.06″ of rain fell in about a 15 hour period. Also what made this statistically a 1/1000 year event was that In one 6-hour period, 7.7” of rain fell! In essence, a narrow zone of 6-12” of rain fell from east/central MO to southern IL, which caused several water rescues of people stranded in homes and devastation as well.

Historic Eastern Kentucky Flooding Event
This event will certainly be the top of the list for 2022 in terms of flooding extremes across the lower 48! The stationary event shown above ties into this event as well, all thanks to that stationary boundary and strong forcing for ascent that culminated to render catastrophic flooding!
Once again, taking the same synoptic setup from the St. Louis flooding, and applying it to Eastern KY resulted in utter devastation. This time, this lasted for several days between July 26th – 29th! Training thunderstorms began the 26th after some light rain the night prior. Thereafter, rounds of thunderstorms repeated over several days and expanded in coverage and increased in intensity. It was reported that up to 4”/hr fell with some of the thunderstorms, which in the end led to a swath of 10-16” when it was all said and done, especially across eastern KY receiving the brunt of it! Not only was the rainfall and flash flooding that prompted mandatory emergencies and evacuations via helicopter and boats, but it was the significant rises and flooding on many rivers in eastern Kentucky. Nearby areas that received a little rainfall dealt with this aspect of flooding from the local rivers cresting above major-flood stage, especially the KY river.
Here are some unfathomable stats:
- Whitesburg, KY, the north end of the river recorded a 21′ major flood stage value, smashing the previous record of just shy of 15′ in 1957.
- The North Fork of the Kentucky River at Jackson set a new record crest of 43.5′ (previous was 43′ in 1939).
- rainfall totals observed were over 600% of normal.
- According to the NWS out of Jackson, KY – The totality of 14-16″ between the 26th to 19th are historic. Statistically-speaking, over any 4-day span, there is less than a 0.01% of that even occurring in any given year!

One more notable event that caused major headlines, was the major flash flooding that occurred out across Arizona – especially across the Apache Junction (NE AZ). Yet another event that happened in July, making for one memorable month to certainly hope to never repeat again in terms of spatial damage and magnitude!
With already in excess of 250% above normal of their climatological rainfall accumulation since June across places like AZ during the monsoon season, this made for already saturated soils even worse in terms of how easily flooding occurred.
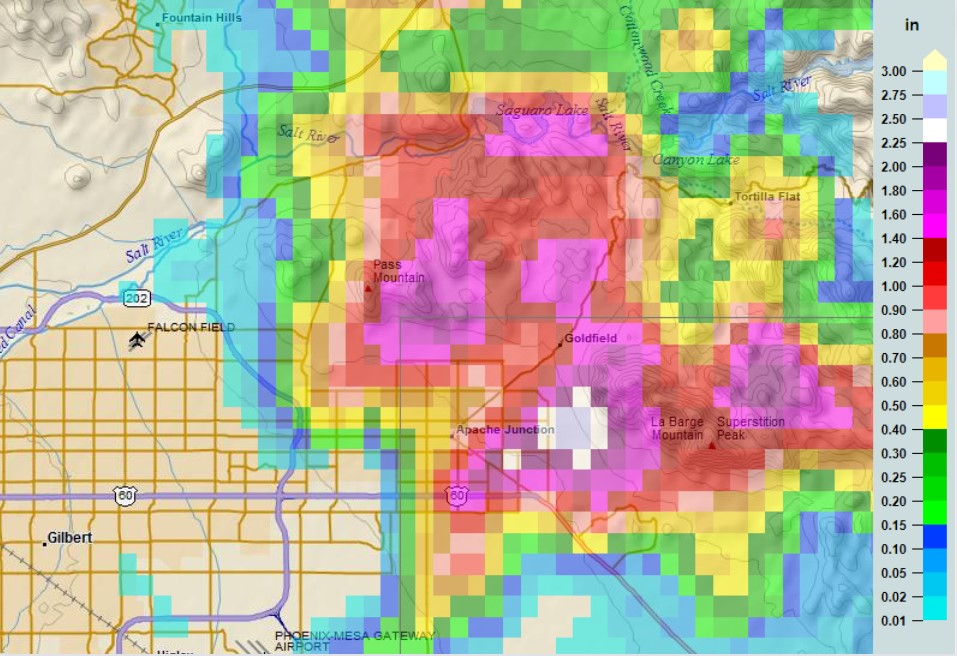
On July 28th, highly anomalous moisture was in place with PWAT’s exceeding the 95th percentile (rare for that period in time) across central and southern AZ. An inverted trough in conjunction with sufficient instability and forcing for ascent yielded enhanced thunderstorms and showers that parked over the area for hours. Also what enhanced this setup was orographic uplift, causing further condensation to occur. Heavy rainfall developed along the mountainous terrain, and this is where 1-3” fell in less than 2 hours by using what is coined the Multi-Radar Multi-Sensor operational product viewer. This tool allows us to view certain products like how much rain fell in a certain timeframe, or how intense maybe a thunderstorm was at a particular time (i.e. reflectivity dBz). We can see a bullseye of nearly 3” shown in a 3-hour interval. This extreme flash flooding caused extreme runoff, facilitating widespread inundation down into the Apache Junction region breaking apart roads, stranding vehicles, and damaging homes. This also prompted water rescues, as devastationmanifested across the entire region.
What makes this setup especially troubling, is that the extreme heat from prior months led to numerous wildfires and burn scars. A fun fact is that we know wildfires burn millions of acres of land every year, which results in altered landscapes. This then has a trickle-down effect that leads to vulnerability of the landscape, making it prone to flooding. However, less well known is that these susceptible areas can also intensify and in some cases initiate thunderstorms due to the lack of vegetation (so sensible & latent heat fluxes are exacerbated upwards since vegetation holds water, and water holds a tremendous amount of heat). Without vegetation, the bare ground has much lower heat capacity, causing the heat to rise and this leads to convection. Again, heat domes as explained above can result in this by the extreme reduction in relative humidity and dryness, then wildfires can be started by natural causes (i.e. winds) or by of course human activity. These burn scars also then cause lands to be prone to flooding and erosion, so now less rainfall is necessary to produce devastating flooding or debris flow than in an otherwise undisturbed environment.
The amount of extremes and natural disasters occur every year as we’re not new to it. Unfortunately, it’s going to continue. What is encouraging, however, is the fact that many meteorologists that work for the NWS or in private sector firms are establishing new ideas every single year in how to properly communicate effective information to the public. It all comes down to how we can integrate ways to the common folk by advancing our knowledge in how the atmosphere works, to save lives, and do whatever we’re currently capable of to get the most important and critical information out to the public!
