A Continuous Onslaught Of Precipitation For The West!
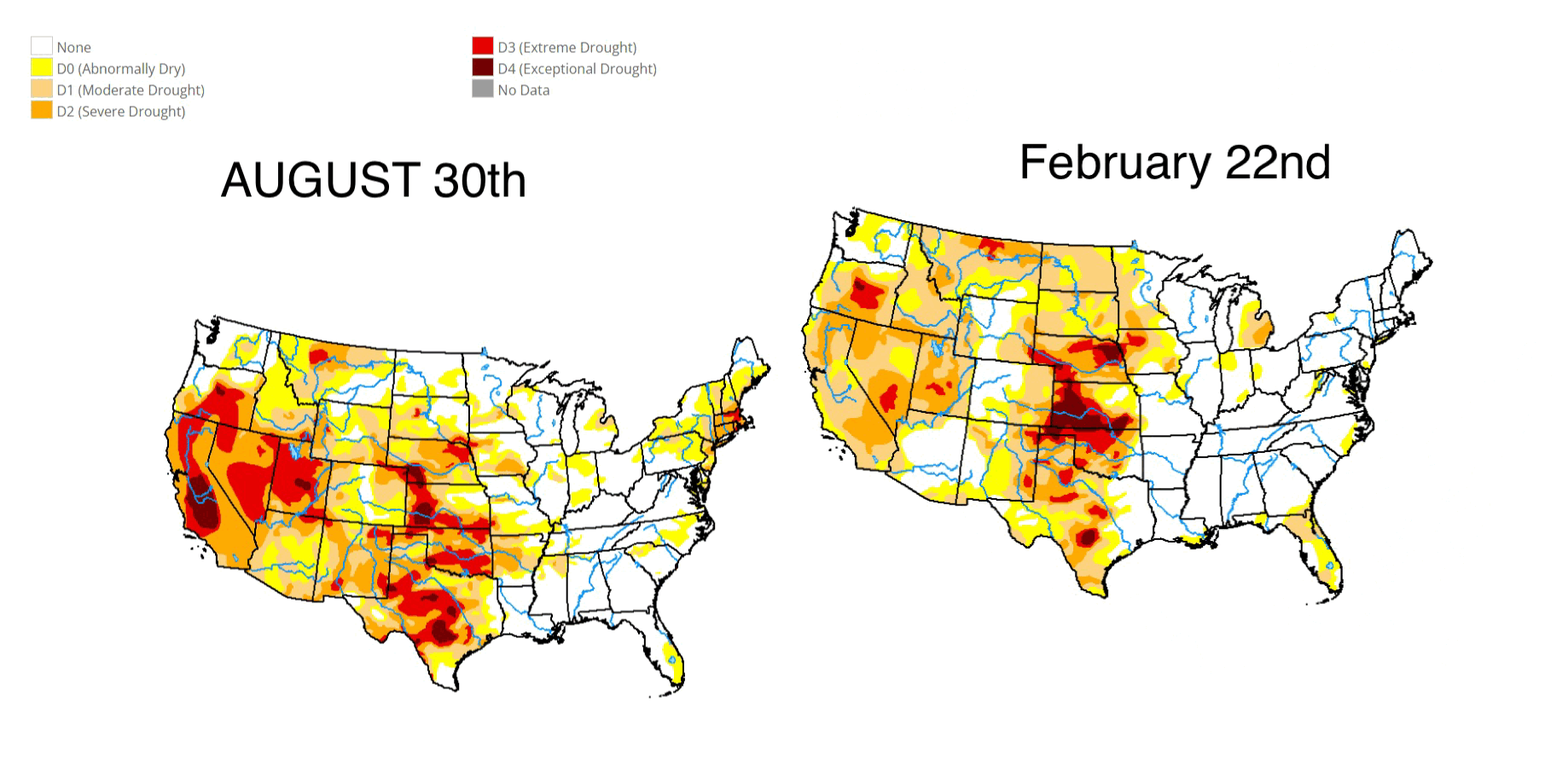
We’ve seen quite the turn-around for the West Coast, and in particular California. In fact, we’ve gone from the category of “extreme drought” conditions, to below a “D2” (severe drought threshold) in approximately six months thanks to an anomalously, persistent weather pattern this winter. We see the differences thanks to the drought monitor site we can easily check to see the state of the CONUS drought implications.
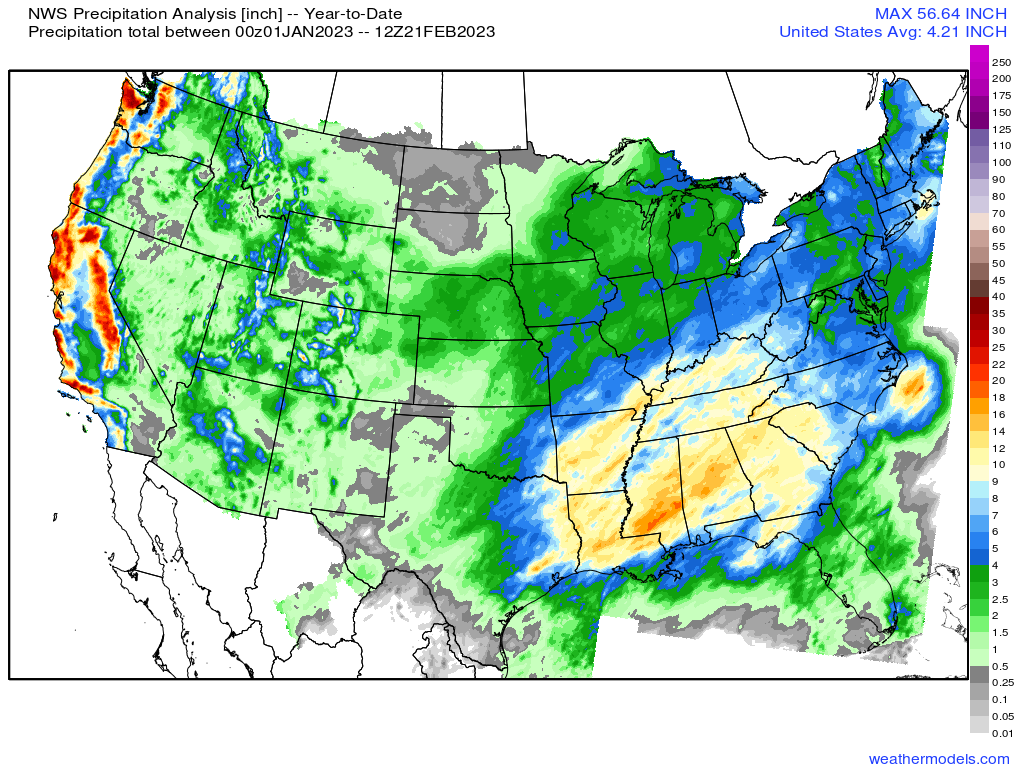
If we simply look at the year-to-date precipitation aggregate thus far, we see what regions clearly stand out and that’s out along the West Coast! So where are we going to go from here?
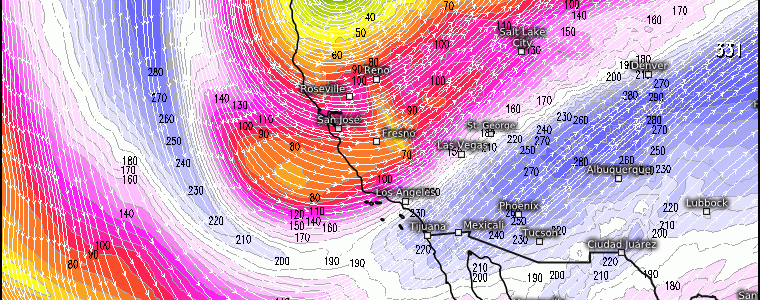
As we analyze the Pacific Jet, which has been quite extended this winter thus far meaning it has been persistently “crashing” into the West Coast bringing moisture advection via troughs, will continue to remain active. We see a meridional configuration with a several jet streaks denoting a north-south orientation, which implies deep longwave troughs and through these troughs we’ll continue to see precipitation opportunities right into March.

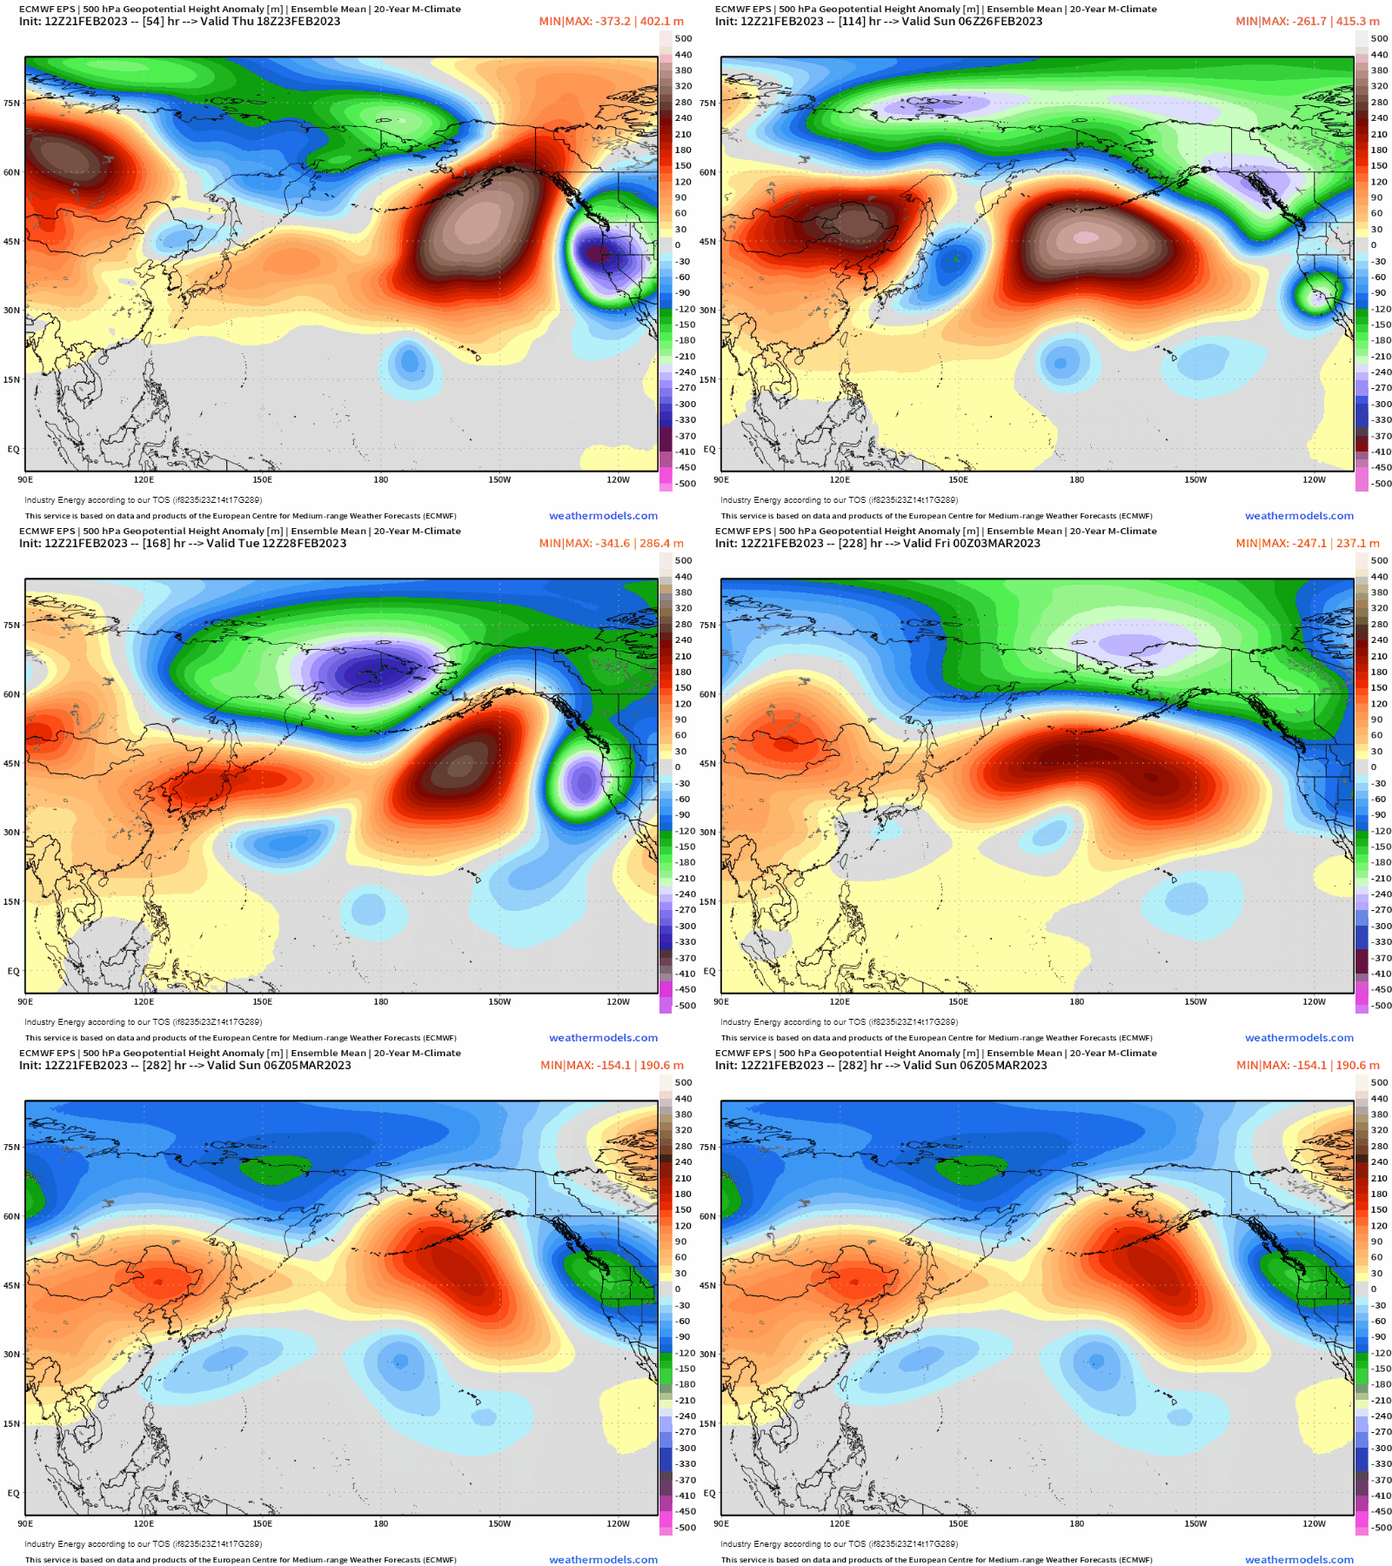
Zooming out to get a glace at the mid-level height pattern, what we see is a typical La Nina North Pacific feature: the northern Pacific anticyclone. In la Nina’s, for the most part during the winter season, it remains a quasi-stationary atmospheric feature. As it continuously “breaks” anticyclonically, you’ll see continuous areas of below average heights form downstream repeatedly. This, along with the overall tropical state across the Indian Ocean & Maritime Continent (i.e. tenacious areas of thunderstorms seen with La Nina’s that influence the general pattern across N.A.), helps to keep a pattern like this quite prevalent in the most simplistic of explanations and can obviously be altered in different la Nina seasons. The point is that this pattern will continue to remain for the foreseeable future, and those familiar with teleconnections know that this is dominant -PNA pattern.
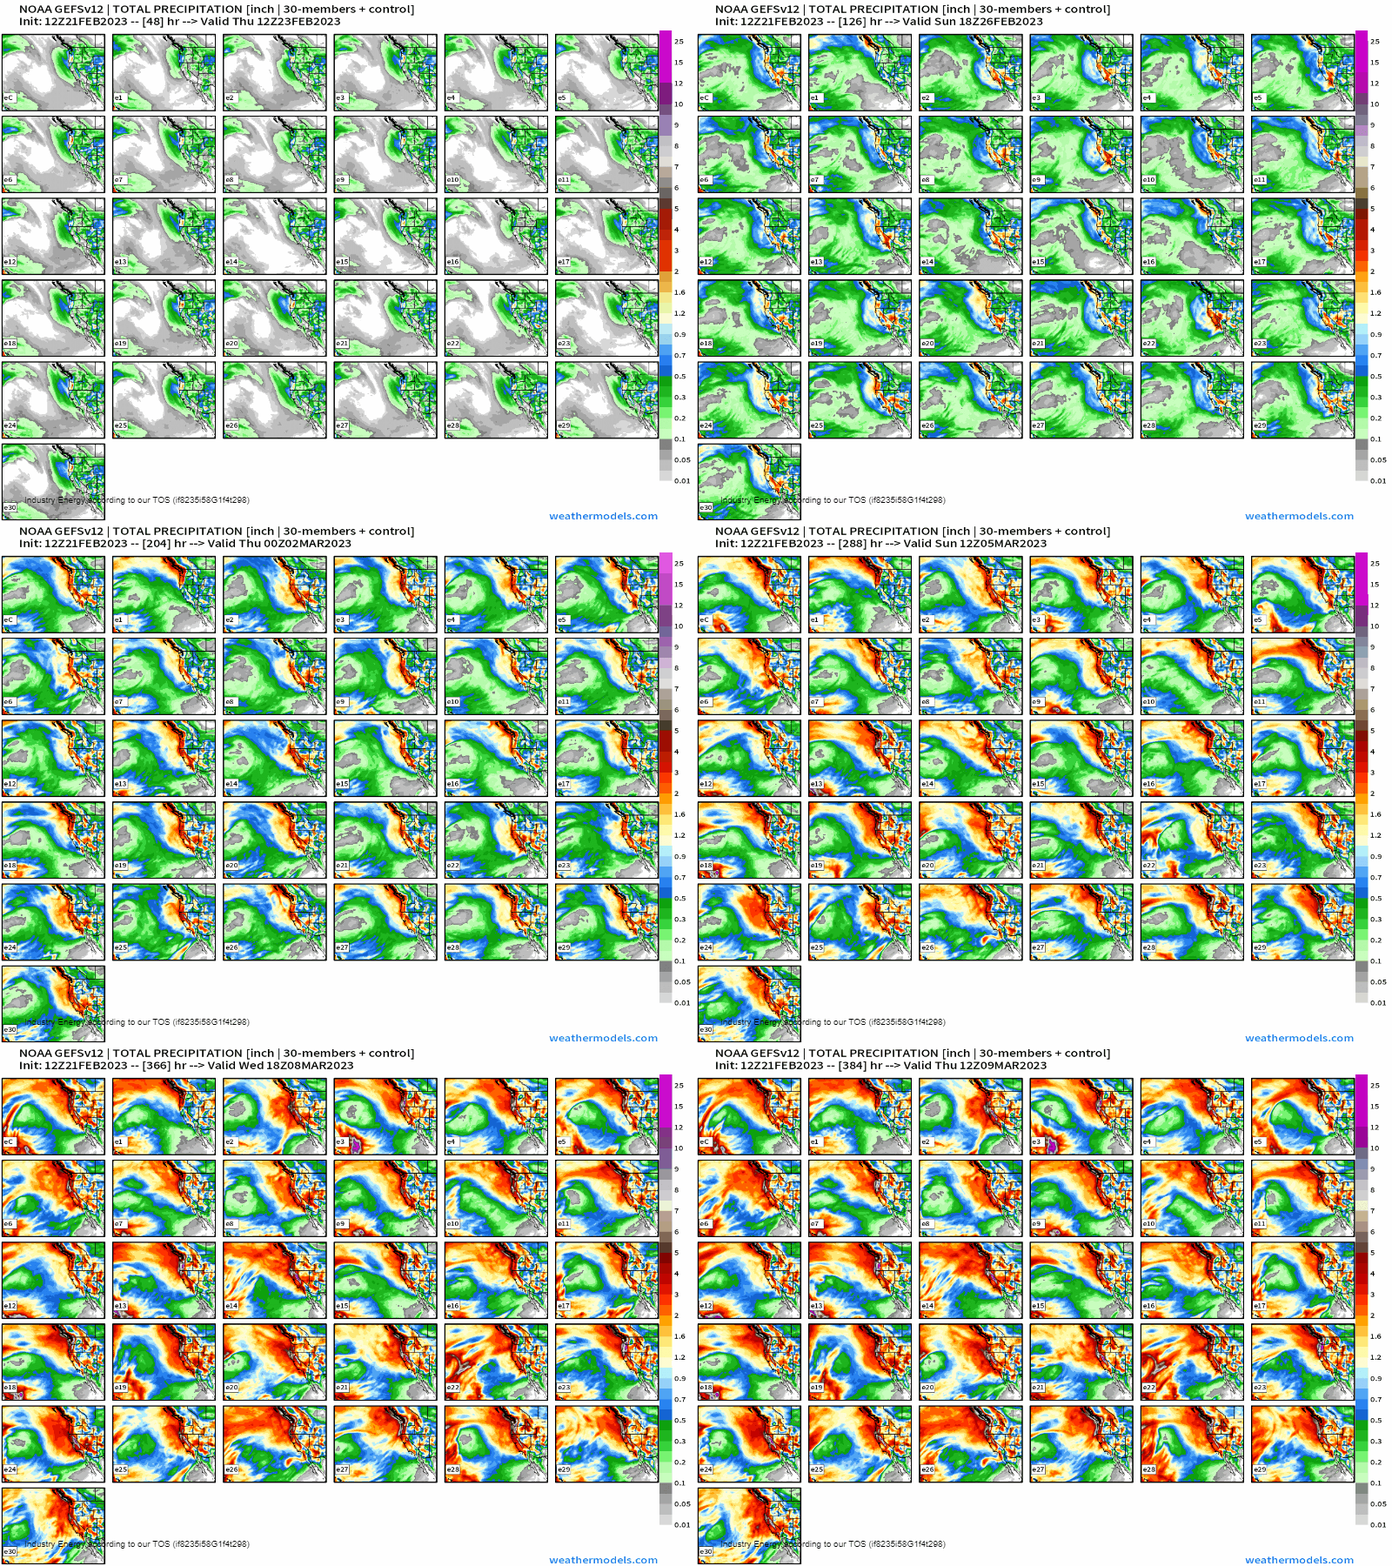
One super neat way to visualize a general idea in terms of how much precipitation we could try to anticipate is through the usage of ensembles. Here, we know ensembles help to collectively render higher confidence by individually taking the atmospheric conditions and perturbing it to try to reduce uncertainty and explain variation in a weather pattern for a particular timeframe. What we actually see here using the 31 ensemble members of the GEFS is quite remarkable agreement in a median value of 4-6” of precipitation (rain and snow!) as we flip into the first week of March for California and pretty much up the West Coast!
It’s quite spectacular that the atmosphere works in ways where we usually see a regression to the mean, though it can certainly take a long time as we know climate describes weather patterns over long periods of time!
