Post Mid-Month Tropics Update
As we approach the latter end of the month of August and nearing the climatological “peak” of the Atlantic hurricane season, we’re beginning to see some signs that tropical activity will begin to pick up.
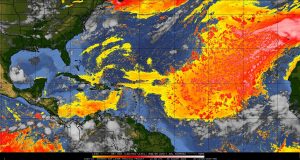
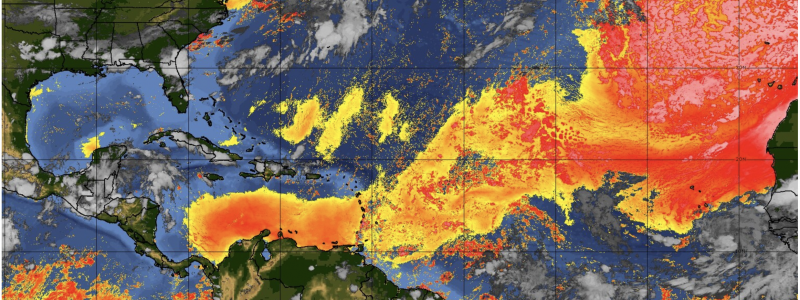
However, I do want to show something of importance: Take a look below at this graph. It’s a graph of the Saharan Air Layer from the CIMSS TC website, and a useful one because this illustrates the current state of the Atlantic regarding dry, dusty air. This, in conjunction with what is known as the “TUTT” – Tropical Upper Tropospheric Trough – a semipermanent trough that is seen in both Pacific and Atlantic basins every summer; this has put a large damper on the tropics. These TUTT’s intensity adjusts seasonally, but this summer in particular, it has hindered tropical cyclogenesis quite significantly. These TUTT lows can lead to two different dynamic processes: induce strong vertical wind shear and transport dry, mid-level air and/or can actually enhance a tropical cyclone by inducing upper-level outflow ventilation, helping the cyclone to actually maintain intensity and strengthen in how there axis can orient in such a way to allow the latter. TUTT’s can also form downstream of anticyclones or if a trough from the mid-latitudes crosses into the Atlantic, it can become cut off from the mean flow and meander into the subtropics.
This summer in particular, the TUTT has stymied Atlantic activity largely by providing steady vertical wind shear and ushering in dry air from the higher latitudes, in conjunction with Saharan Dust.
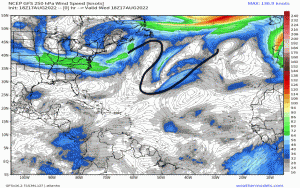
Utilizing the 250mb upper-level height winds, which can be accessed here, I’ve annotated and outlined this quasi-stationary feature that prevails through this week and into early next week. This E-NE to WSW oriented axis induces vertical wind shear downstream, and infusing dry air into the subtropics and tropics.
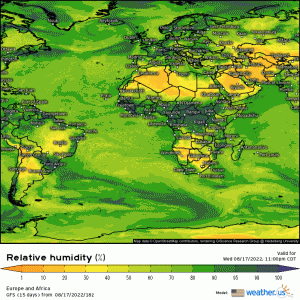
Tropical cyclones also need to have very moist environments to allow convection in the form of thunderstorms. Dry air induces downdrafts and dry air inhibits rising motion. Note this week how relatively dry Western Africa and generally, the entire MDR is. This aligns nicely with the first image showing how disruptive the dry air layer and Saharan dust has been this season!
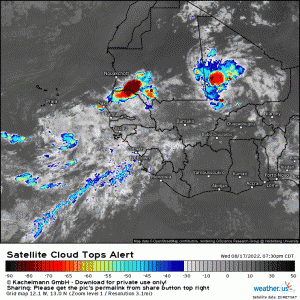
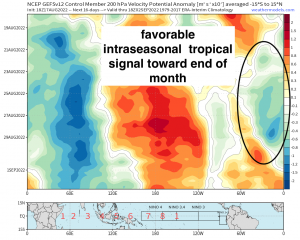
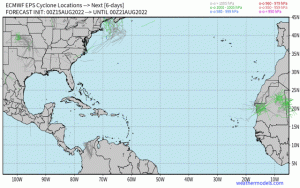
Having said this, we may be “turning the corner” as we approach the end of the month however. There are signs, with the help of an intra-seasonal tropical signal via a GEFS hovmoller (below), that we’re going to be soon dealing with a possible active end to the month with an uptick in easterly waves as soon as next week. We’re also approaching Cape Verde season, which is where we’ll begin to see the robust tropical waves emanate off Africa. For instance, here are two tropical waves from earlier this week that verbatim weren’t too shabby looking, so the environment will continue to get “help” from tropical waves helping to moisten the ambient atmosphere as they enter the Atlantic.
After a period of unfavorable tropical forcing, this’ll adjust in time as we approach a climatological favorable period as we begin to see broad, rising motion manifest across the Indian Ocean and extending onto Africa (this provides easterly waves with sufficient relative humidity and renders the environment less hostile).
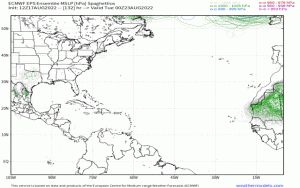
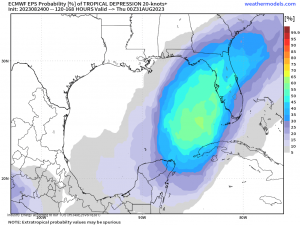
Now, as we head into last two weeks of the month, watch as numerical weather guidance such as the EPS and GEFS show active tropical cyclone tracks – something we’ve not seen really all summer across the Atlantic.
Here are the EPS spaghettios, displaying a various range of intensity as this timeframe. There are a copious amount of members as well showing a cluster of potential tropical storms toward the end of the month especially.
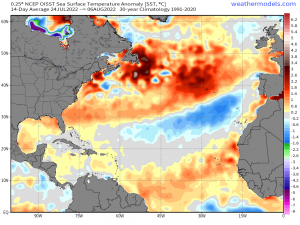
The sea surface temperatures across the MDR, Caribbean Sea, Gulf of Mexico, and off the entire East Coast since the end of July have been above normal, which is one of the critical ingredients for tropical cyclones to be able to tap into “fuel” (The above normal SST’s verbatim are averaging above the 27.5*C threshold that we see tropical cyclones prefer in these aforementioned regions). In fact, according to hurricane specialist Michael Lowry, the MDR currently is running well above the 1981-2022 average (Source).
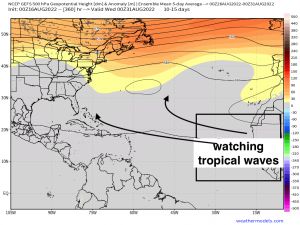
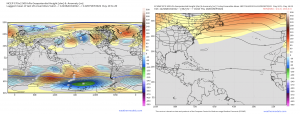
A synoptic “snapshot” shows an interesting z500mb pattern through the end of the month and into September across the Atlantic basin. Agreement can be seen between the GEFS, EPS, and the CFSv2 weeklies a pattern featuring two anticyclones where one will be within the vicinity of the Northeastern Atlantic and another across the Southwest Atlantic (a.k.a Bermuda Ridge). Verbatim, this type of mid-level steering flow supports two main tracks: One that recurves in between the ridges where there is a general weakness, and another that if a wave were to develop and mature – it could make its way into the Caribbean or poleward of the Lesser Antilles. This track would present issues of course, since the Bermuda ridge could surely steer the track toward the U.S.
It remains to be seen how the next two weeks pan out and into the first week of September. While signs point to an active spurt with waves coming off Africa and the ITCZ out in the eastern MDR, we’ll have to see how the ambient environment develops. Do we still have issues with low/mid-level dry air and thermodynamic properties (i.e. stability), or will certain waves “sacrifice” themselves that end up setting a foundation for the waves behind? Surely at this juncture we may see the latter pan out amid an improving background environment via intraseasonal forcing. It also does appear vertical wind shear will ease by the end of August and into September, so that window certainly bears watching within a favorable climatological time-period to boot. We’re already beginning to see signs of life show as discussed above with solid agreement in numerical weather models which have support. We’ll be monitoring and tracking over the course of the next few weeks so make sure you follow along!
