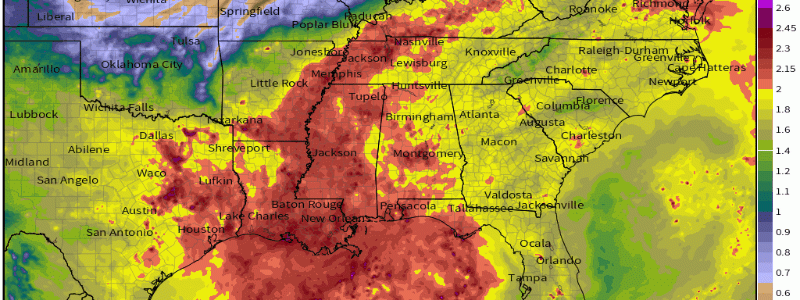
Precipitable Water (“PWAT”): What Is It And How Can It Be Used In Forecasting?
It’s summer and we’re well established within the warmer months, so it’s fitting to discuss the concept of precipitable water: how do meteorologists and forecasters use it, how it can be useful, and the overall concept of what it means.
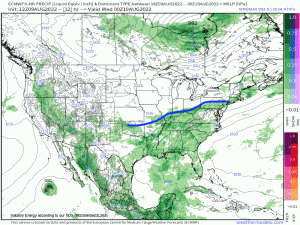
More pertinently, we’ve seen catastrophic flooding over the past two weeks across places such as Eastern Kentucky that have been ravaged by ceaseless heavy rainfall. Unfortunately, we’ve seen portions of the Ohio Valley – specifically Kentucky once again – suffer from several more inches of rain that has fallen over the past two days. The reason for the flash flooding and accrued rainfall was a result of a stationary front (annotated below via ECMWF 6-hourly precipitation & MSLP) where a combination of moisture and heat to the south of it has produced periods of heavy rainfall leading to flash flooding. This front has acted as a lifting mechanism that essentially allowed the warmer and moist airmass to the south (deriving from the gulf and southwest Atlantic) to rise in the vertical producing precipitation.
Taking a closer look at this now through the utilization of Precipitable Water, A.K.A “PWAT”, gives us an advantage for determining the amount of moisture in the air at a specific point in time. Since the atmosphere is capable of holding tons of moisture, which is transported all around the globe, it’s important to see how exactly that moisture may ultimately lead to precipitation for certain areas.
What exactly is it? It essentially is defined as if a specific volume of atmospheric water vapor over an area were to completely condense, how much of that would fall as condensed precipitation in that same volume from where the water vapor came from. In other words, how much water can be “rinsed” out and obtained from a hypothetical volume of the atmosphere to the surface at any time. For those who are like me and need to conceptualize certain concepts with analogies, this helps as a supplement. If you think of a sponge that is fully saturated and you squeeze the sponge entirely, you’d see a dose of water fall to the ground. The sponge is the atmosphere holding moisture (in this case it’d be water vapor), and then we see condensation leading to liquid water.
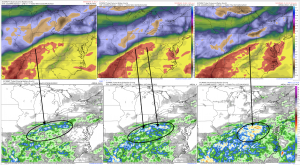
While utilization of this product is helpful in showing what areas and where have more moisture (i.e. tropics harbor the greatest values, which makes sense given the abundance of warm, moist air!), it should be emphasized that precipitable water values like shown below doesn’t exactly equate to that value at the surface; rather, it just correlates well the concept that higher PWAT values can mean higher amounts of rainfall and vice-versa! Take a look below using the ECMWF precipitable water product (Link). This shows a time progression from Wednesday morning (August 10th) through the day and into earlier this morning of both precipitable water (top row) measured in inches, and the bottom row that displays total accumulated precipitation. I’ve outlined to better pick out and understand this concept of why we look to see where the higher values (in this case, PWAT values hovering around 2″ and greater) are modeled to be. Notice that the higher values align very nicely with where the heaviest precipitation fell. This same idea can help forecasters pinpoint where the heaviest axis of rainfall may occur that could lead to potential flooding, yielding flash flood watches and warnings to ultimately mitigate risk to the public! This is just another “tool” that gives an advantage in forecasting where flooding may arise and from a factual standpoint, flooding is the second behind heat in terms of weather-related deaths.
Now, not highlighted but easy to see, notice the darker colors (i.e. brown) juxtaposed with the higher PWAT values that is situated to the north of the stationary front discussed at the beginning. You can easily see the correlation nicely as in the total accumulation graphics (bottom row), you don’t see much, if at all, any rainfall where the lower PWAT values are located in these moments of time and space.
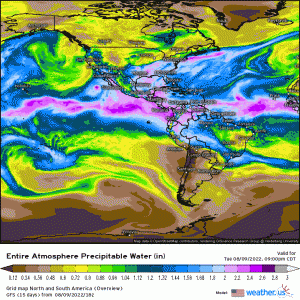
I mentioned the tropics as well, and it isn’t surprising to see that this area on Earth contains the highest moisture content verbatim and especially during the summer months of both hemispheres. Now precipitable water varies with seasons and you can have a location in the mid-latitudes for example contain a higher PWAT value at a specific point in time than somewhere close to the equator. In this loop below, you can actually point out Hurricane Howard – located several hundred miles southwest of Mexico, (named as of August 8th as the seventh East Pacific hurricane of the season) drifting to the northwest through the “lens” of moisture content. Tropical cyclones are essentially “heat engines” that carry enormous amounts of energy in the form of water as well, transporting it poleward and we’re also aware of the astounding amount of rainfall tropical cyclones can produce!
I do want to emphasize another point regarding precipitable water and temperatures, wrapping this back around “full circle” to the first statement of this blog. I’m sure you’ve read or heard somewhere that “warm air holds more water”. This paradigm is incorrect and let me explain! Temperature is simply defined as the average kinetic of molecules; higher kinetic energy of molecules lead to faster motion of them “bouncing” around. Imagine two bubbles: one bubble is 30*F and the other is 70*F. The colder bubble has slower movement of molecules; therefore, water molecules will “stick” together much easier and the intermolecular forces binding them together make it harder for these molecules to break apart as opposed to the warmer bubble. Those molecules in the warmer bubble will be moving much faster, and have more potential energy to break that binding force. This implies greater evaporation and condensation, so it requires more water vapor to ultimately allow 100% saturation to manifest, resulting in total condensation! So in a sense, warmer air just has the greater capacity of containing water vapor molecules relative to colder air because simply of how much more evaporation takes place with warmer temperatures (remember, for condensation to completely occur, saturation is reached when we have condensation rate = evaporation rate at 100%). Hopefully that elucidated confusion or enlightened your initial idea of this concept because it surely did for me!
Hopefully this little “mini” lesson in the grand scheme of meteorology and how our atmosphere operates, taught a brand new concept that you were able to grasp and other sub-topics embodied within this abstract!


I really like your post explaining the parameter and how useful it is and how to use it.
thanks