Fun With Maps: A Look at Yesterday’s Impactful Flash Flooding
We’re doing something a little different in today’s blog. I thought since yesterday’s widespread flash flooding in Alabama was such a significant event, we’d use some of the tools from weather.us to look at just how impressive it was. Jacob discussed the set up yesterday in his blog along with his concerns for flash flooding, which verified. If you’re curious how it came together, definitely go read that blog. We’re just going to look at the results.
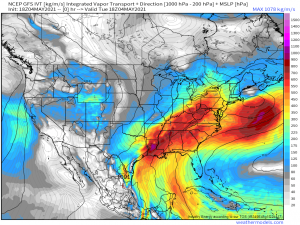
Before we delve into the results, though, I wanted to share the integrated vapor transport parameter from the 18Z GFS yesterday.
Just look at all that deep moisture being pulled out of the Gulf into the south. The deepest reds and even pinks line up right over the areas that saw impressive rainfall totals from multiple rounds of storms.
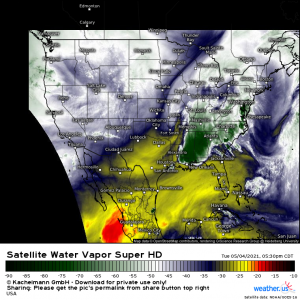
If we look at the Water Vapor enhancement on the satellite loop from yesterday, found in weather.us‘s archives, it tells much the same story. Very deep moisture was in place over the south and it made it’s presence known. Even the dew points, indicative of the amount of moisture in the air, were rather steamy for early May. Central Alabama observed dew points in the mid 70s (observations here, if you’re curious), which is more like mid-summer levels than mid-spring.
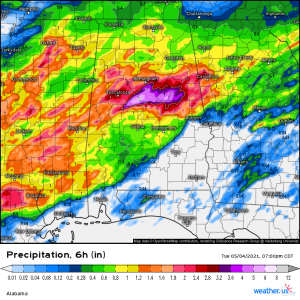
So all that moisture combined with a bit of forcing lead to crazy amounts of rain. I’ve seen it said that it rarely ever rains all day long. Yesterday was one of those “rare” days. However, the heaviest rain, at least for central Alabama where the flash flooding emergency occurred, most of that rain happened in about a 6 hour window.
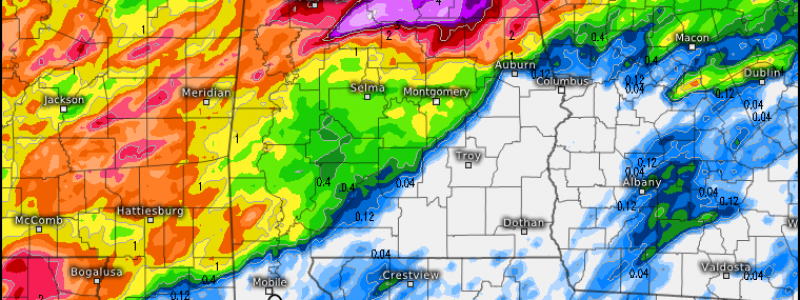
The above map is the radar-estimated precipitation for a 6 hour window ending at 7 pm yesterday. Central Alabama received a swath of 6 to 8 inches of rain roughly between 1 pm and 7 pm yesterday. That’s incredible. We generally see totals like that out of tropical systems, not regular convective events.
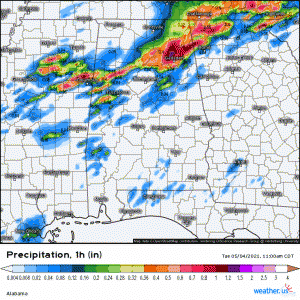
(gif) Link
The 1 hour precip analysis is equally impressive. First we see training bands that brought the earlier round of flash flooding to the Birmingham metro/Jefferson County area. Then, a few hours later, we see the slow-moving convective line that focused the heaviest precip on Shelby County, bringing on a second round of flash flooding and exacerbating conditions in the Jefferson County area.
Fun Fact: I lived in Shelby County from 2013 to 2019. Between this flooding and the tornadoes in March, it’s been surreal seeing the area I know so well repeatedly smashed by severe weather.
One final map:
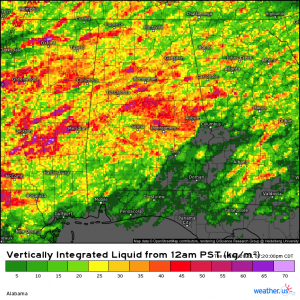
This is the Vertically Integrated Liquid from 7 pm yesterday. VIL records the highest return inside the storm, regardless of height. It’s pretty incredible to see so many values above 45 dBZ over so large an area. A real testament to exactly how much moisture was available.
Well, that concludes our look back at the liquid portion of yesterdays event with all of our fun maps. If you have a relatively recent event you’d like to look at using any of these maps, our archive extends back through 2017 for the maps I used in this blog. We also have the ERA5 Reanalysis that extends back to 1950. Hop on over to weather.us and try them out!
